نظرة عامة على المشروع:
يقدّم هذا المشروع تحليلًا استكشافيًا شاملًا (EDA) لبيانات ركاب Titanic بهدف تحويل البيانات الخام إلى رؤى دقيقة تكشف أنماط النجاة والعوامل الاجتماعية والاقتصادية المؤثرة فيها، موضحًا قدرتي على تنظيف البيانات واستكشافها وتصوّرها واستخلاص النتائج باستخدام أدوات Python التحليلية.
أهداف المشروع:
تحليل الخصائص الديموغرافية والعوامل المؤثرة في النجاة، ودراسة العلاقة بين العمر، النوع، الدرجة، والسعر وتأثيرها على فرص البقاء، مع إبراز مهاراتي في معالجة البيانات والهندسة المميزة والتحليل البصري وتقديم رؤى تطبيقية مدعومة بتمثيلات دقيقة وواضحة.
الأساليب التحليلية:
تنظيف ومعالجة البيانات (القيم المفقودة، الأنماط غير الطبيعية، تحويل الأنواع)، تحليل السمات لاكتشاف مؤشرات النجاة، التمثيل البصري عبر Matplotlib، Seaborn، وPlotly لإظهار الاتجاهات، والتحليل الإحصائي للتحقق من الارتباطات، مع سرد قصصي تحليلي يربط النتائج بمعناها الواقعي.
الأدوات:
Python (Pandas, NumPy, Matplotlib, Seaborn, Plotly) · Jupyter Notebook · تقنيات سرد البيانات والتحليل البصري
النتائج:
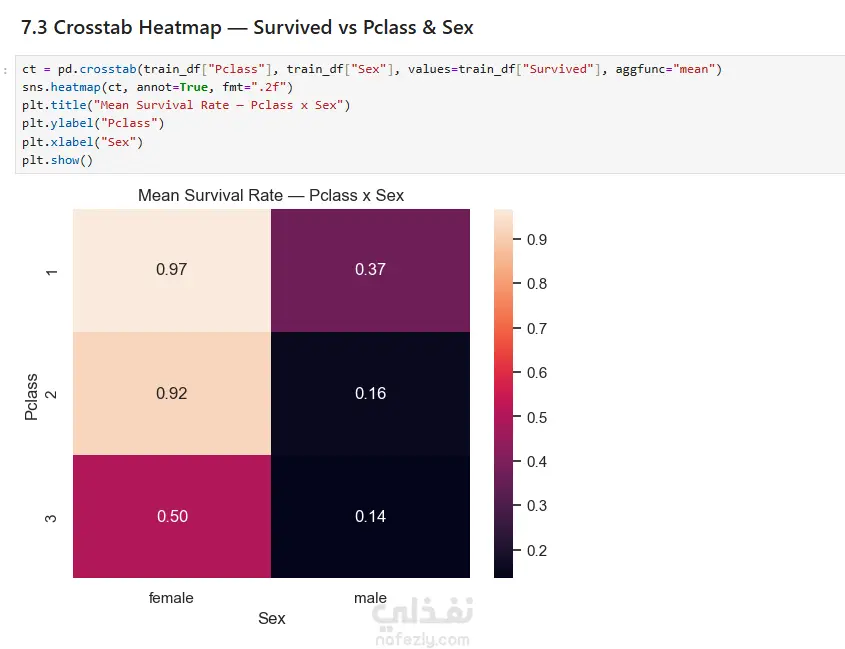
النساء والأطفال امتلكوا أعلى نسب نجاة.
ركاب الدرجة الأولى كانت فرصهم أكبر بكثير.
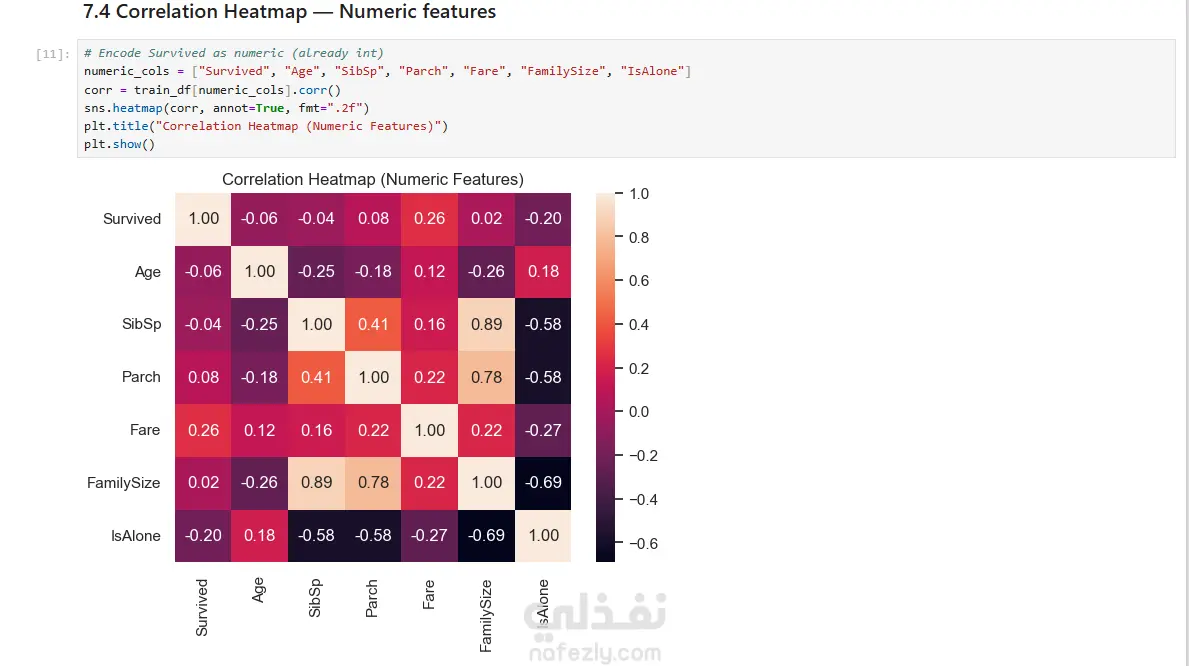
الطبقة الاجتماعية، السعر، والعمر أثّروا مباشرة على احتمالية البقاء.
النتيجة النهائية:
يعكس المشروع مزيجًا من المهارة التقنية والفكر التحليلي في تحويل البيانات إلى قصة رقمية واضحة، ويمثل مثالًا احترافيًا في التحليل الاستكشافي والتمثيل البصري واستخلاص الرؤى، مما يجعله إضافة قوية لأي ملف أعمال في تحليل البيانات.
Project Overview:
This project presents a comprehensive Exploratory Data Analysis (EDA) of the Titanic passengers dataset, transforming raw data into analytical insights that reveal survival patterns and key socio-economic factors. It showcases my ability to clean, explore, visualize, and derive insights using Python’s data analysis tools.
Objectives:
Analyze demographics and identify survival factors; examine links between age, gender, class, and fare; demonstrate skills in data preprocessing, feature engineering, and visualization; and deliver actionable, well-visualized insights.
Analytical Methods:
Performed data cleaning and preprocessing (handling missing values, outliers, and data types), feature analysis to identify survival indicators, and visualization using Matplotlib, Seaborn, and Plotly to uncover patterns and validate correlations through statistical analysis, supported by data storytelling for real-world context.
Tools & Techniques:
Python (Pandas, NumPy, Matplotlib, Seaborn, Plotly) · Jupyter Notebook · Data storytelling methods
Key Findings:
Women and children had the highest survival rates.
First-class passengers had much higher rescue chances.
Social class, fare, and age significantly influenced survival.
Conclusion:
This project integrates technical expertise with analytical reasoning, converting data into a clear digital story. It’s a strong professional example of exploratory analysis, visualization, and insight generation, ideal for a data analytics portfolio.