Bank Financial Performance Dashboard — Power BI
تفاصيل العمل
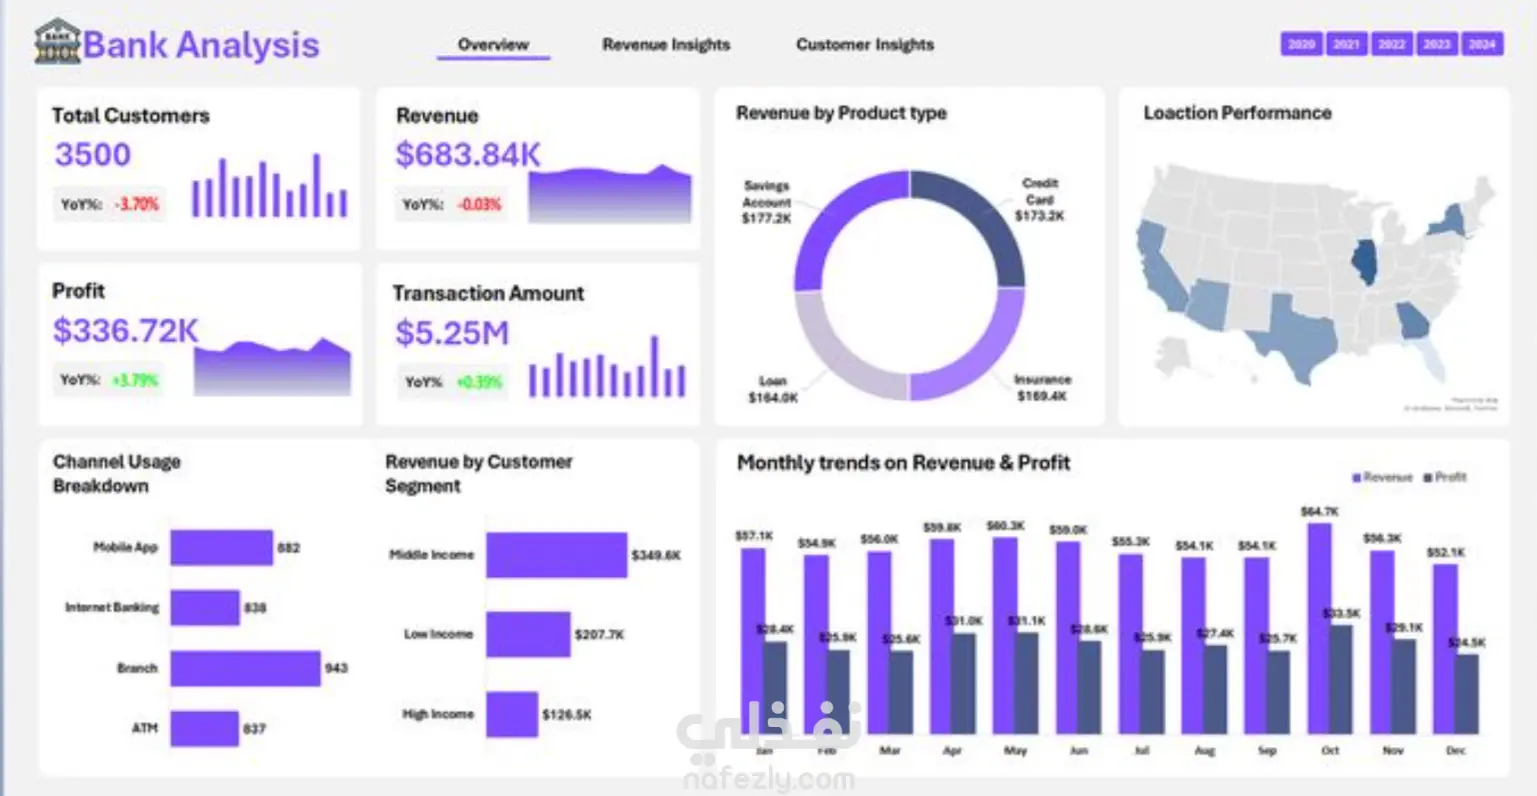
Designed and developed an interactive Bank Analysis Dashboard using Power BI, covering financial performance across multiple years (2020–2024). The dashboard provides executives and analysts with a centralized view of key metrics including total customers, revenue, profit, and transaction volume — with year-over-year trend indicators. Key features include revenue breakdown by product type (Savings, Credit Card, Insurance, Loan), customer segmentation by income level, channel usage analysis (Mobile App, Internet Banking, Branch, ATM), location performance across U.S. states, and monthly revenue vs. profit trends. The dashboard is designed for multi-page navigation with an Overview, Revenue Insights, and Customer Insights tabs — enabling decision-makers to drill down into each area seamlessly.
مهارات العمل