Financial Performance & Profitability Dashboard
تفاصيل العمل
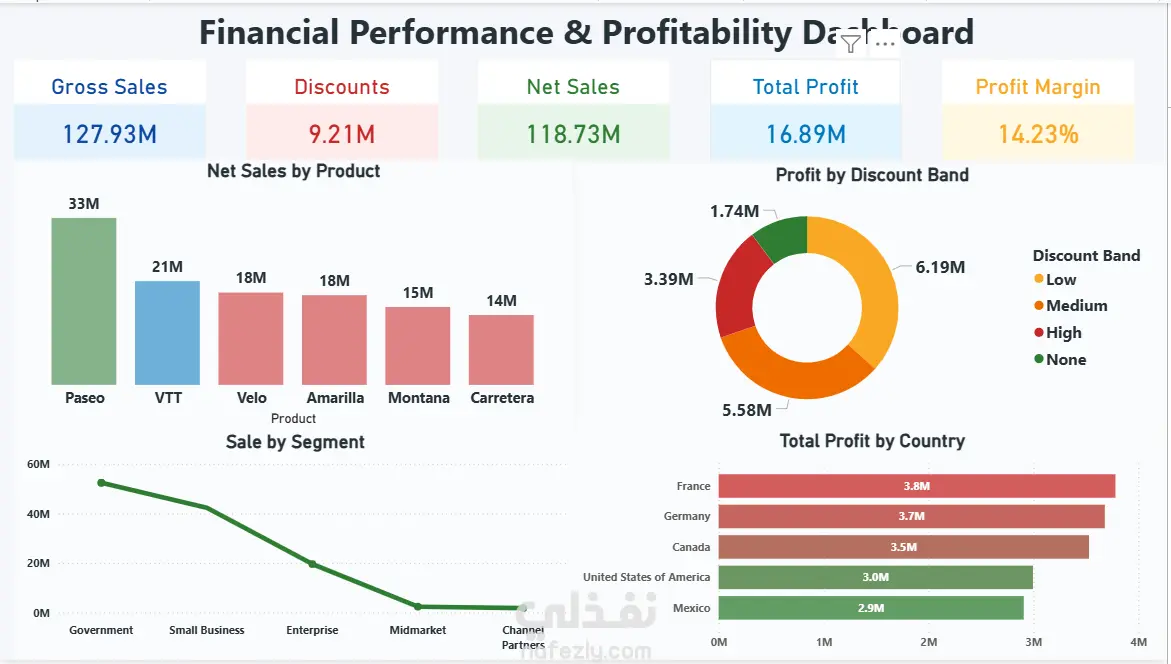
📋 Overview This dashboard provides a clear view of financial performance by analyzing revenue, discounts, costs, and profitability across products, segments, and countries. 📊 Key Insights The analysis covers $127.93M Gross Sales, reduced by $9.21M Discounts, resulting in $118.73M Net Sales and $16.89M Total Profit, with an overall 14.23% Profit Margin. The dashboard highlights product-level performance, with Paseo generating the highest net sales at $33M, followed by VTT ($21M) and Velo ($18M). It also evaluates profitability by discount bands, showing that low and medium discounts contribute the largest share of profit, while high discounts significantly reduce margins. Country-level analysis identifies France ($3.8M) and Germany ($3.7M) as the top profit contributors. 💼 Business Value Supports pricing optimization, profitability analysis, and data-driven financial decision-making.
مهارات العمل
بطاقة العمل

طلب عمل مماثل