Overview:
A comprehensive data visualization project designed to analyze and understand customer attrition patterns. This interactive dashboard provides actionable insights into why customers leave, enabling businesses to implement data-driven retention strategies.
Key Technical Features:
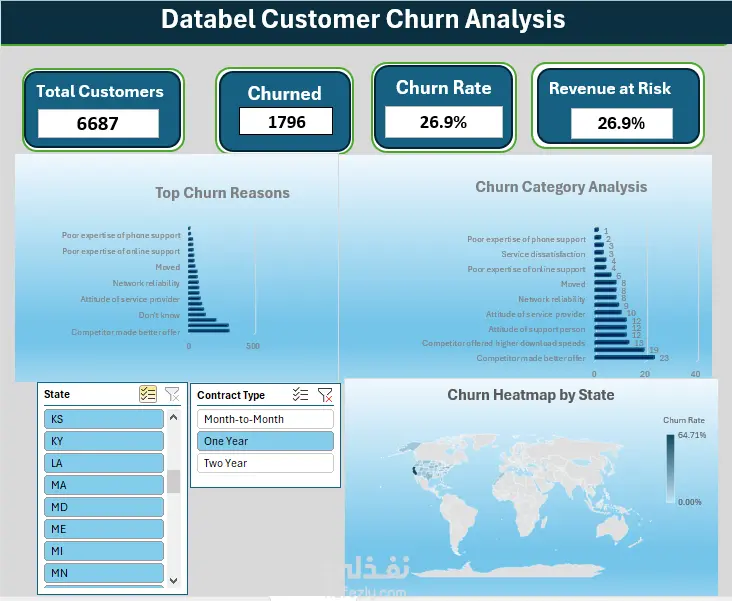
KPI Tracking: Real-time monitoring of Total Customers, Churned Count, Churn Rate (26.9%), and Revenue at Risk.
Root Cause Analysis: Visual breakdown of the primary drivers behind customer loss, such as competitor offers and technical support quality.
Geographic Heatmap: A spatial distribution of churn rates across different regions to identify high-risk territories.
Dynamic Filtering: Integrated slicers for "Contract Type" and "State" allowing for granular data exploration and segmented analysis.
Actionable Insights: Categorized churn analysis to distinguish between service dissatisfaction and external market factors.
Tools & Skills:
Advanced Microsoft Excel: Data cleaning, Pivot Tables, and Dashboard Architecture.
Data Visualization: Specialized in creating intuitive, high-impact visual reports.
Business Intelligence: Turning raw data into strategic business insights.