In this project, I transformed a raw, unorganized sales dataset into a professional automated dashboard. The project highlights my ability to handle end-to-end data processing:
Data Cleaning & ETL: Managed the "Sales Not Cleaned" dataset by removing duplicates, fixing formatting errors, and handling missing entries using Power Query.
Data Modeling: Established relationships and created a "Sales Cleaned" version ready for analysis.
Pivot Tables & Calculation: Developed advanced Pivot Tables to aggregate sales by region, product category, and time periods.
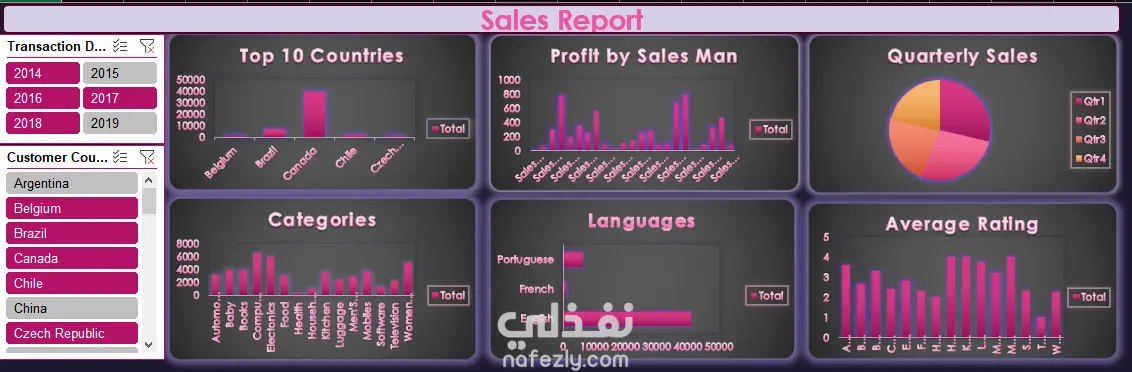
Interactive Dashboard: Built a visual reporting interface that allows stakeholders to filter data dynamically and monitor revenue trends and top-performing products.
Outcome: Improved data accuracy and reduced reporting time by automating the manual cleaning process.
Tools & Technologies: Microsoft Excel (Advanced), Power Query, Pivot Tables, Data Formatting.