Project Type:
Data Analysis & Business Intelligence Project
Project Overview:
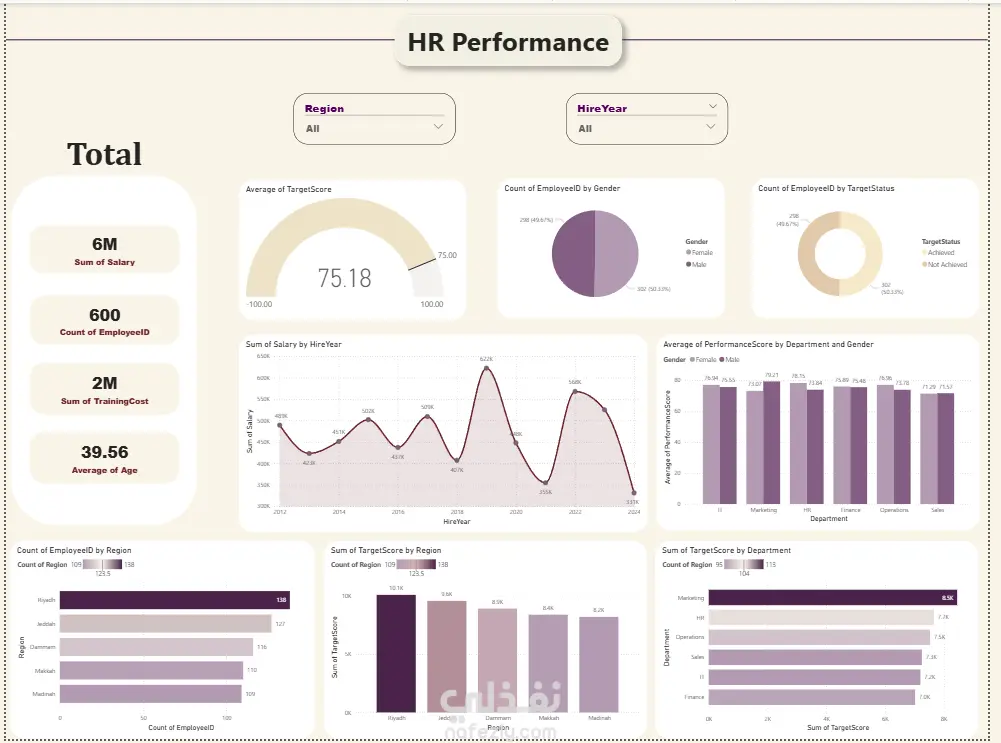
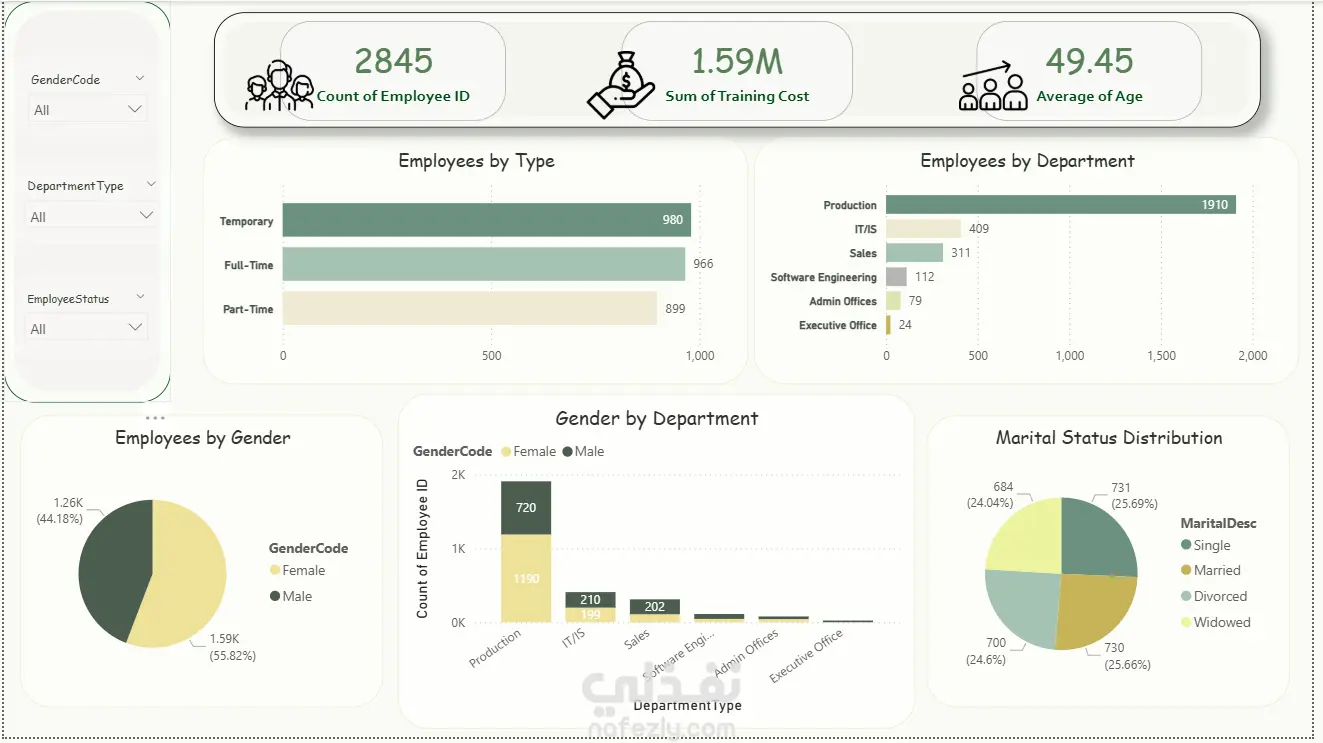
Developed an interactive Power BI dashboard to analyze Human Resources (HR) data and evaluate employee performance across multiple dimensions. The project focuses on delivering data-driven insights to support HR decision-making, improve workforce performance, and optimize organizational efficiency.
Key Features:
Built key HR KPIs including Total Salary, Employee Count, Training Cost, and Average Age
Analyzed employee distribution by region and gender
Evaluated performance using Target Score and performance metrics
Conducted trend analysis of salary over hiring years
Compared performance across departments and genders
Implemented interactive filters (Region, Hire Year) for customized analysis
Designed a clean and intuitive dashboard for effective data storytelling
Implementation Approach:
Collected and cleaned HR data to ensure accuracy and consistency
Performed data transformation and preparation for analysis
Built a structured data model داخل Power BI
Created calculated measures باستخدام DAX لتحليل الأداء والمؤشرات
Developed interactive visualizations aligned with HR business needs
Applied data storytelling techniques to highlight key insights
Validated results to ensure reliability for decision-making
Tools & Technologies:
Power BI | DAX | Data Modeling | Data Analysis | Data Visualization