Sales Distribution Dashboard
تفاصيل العمل
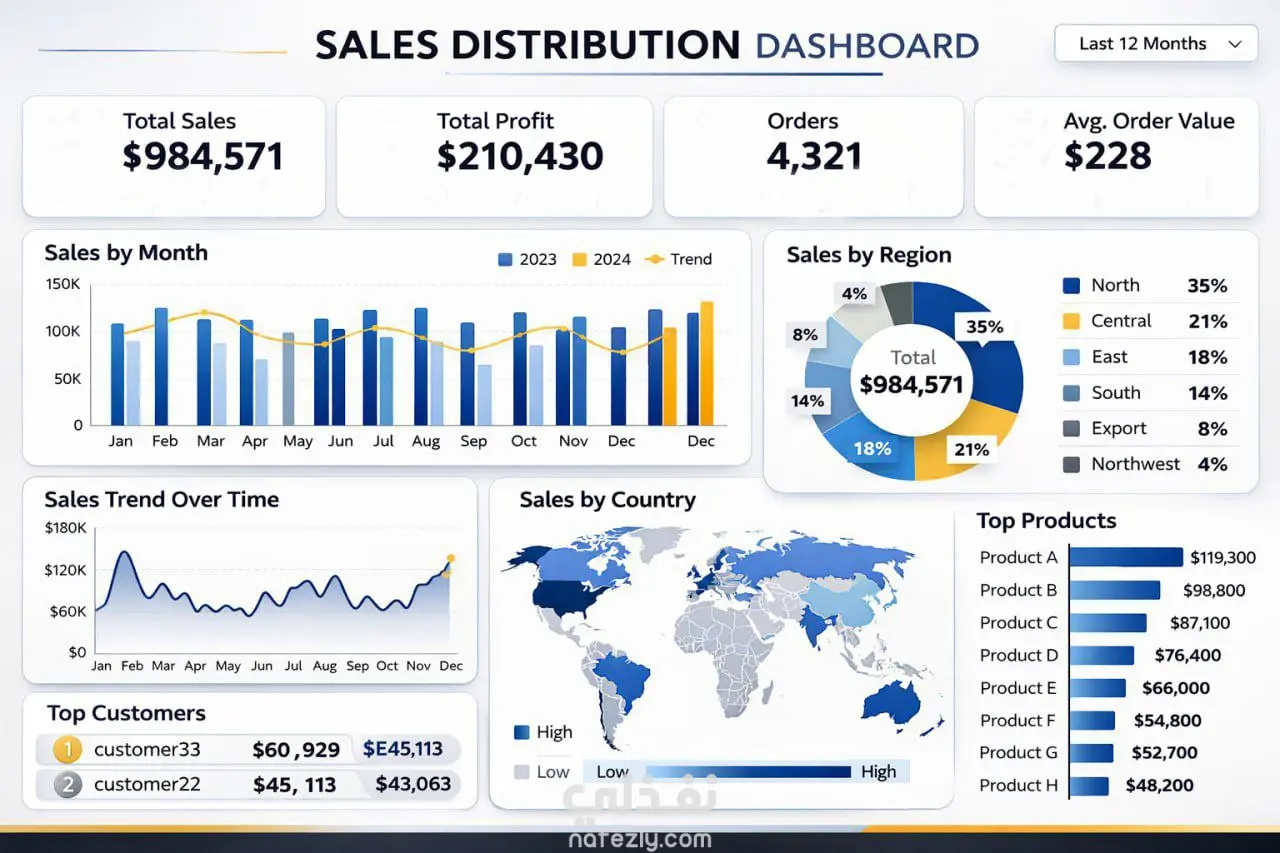
This project presents an interactive sales dashboard developed to analyze and monitor business performance over a 12-month period. The dashboard provides a structured overview of key performance indicators, including total sales, profit, number of orders, and average order value. It also visualizes monthly trends, regional performance, and highlights top customers and best-performing products. The project was implemented through data cleaning, basic data modeling, and KPI calculation, followed by designing a clear and user-friendly dashboard layout.
مهارات العمل