Just Launched Super_Store Power BI Analytics Dashboard Turning Data into Strategic Wins
I am excited to share my latest project a fully interactive Power BI dashboard for Super_Store designed to transform raw sales data into actionable business insights. This dashboard delivers comprehensive visibility into retail performance enabling data-driven decision-making for stakeholders across the organization.
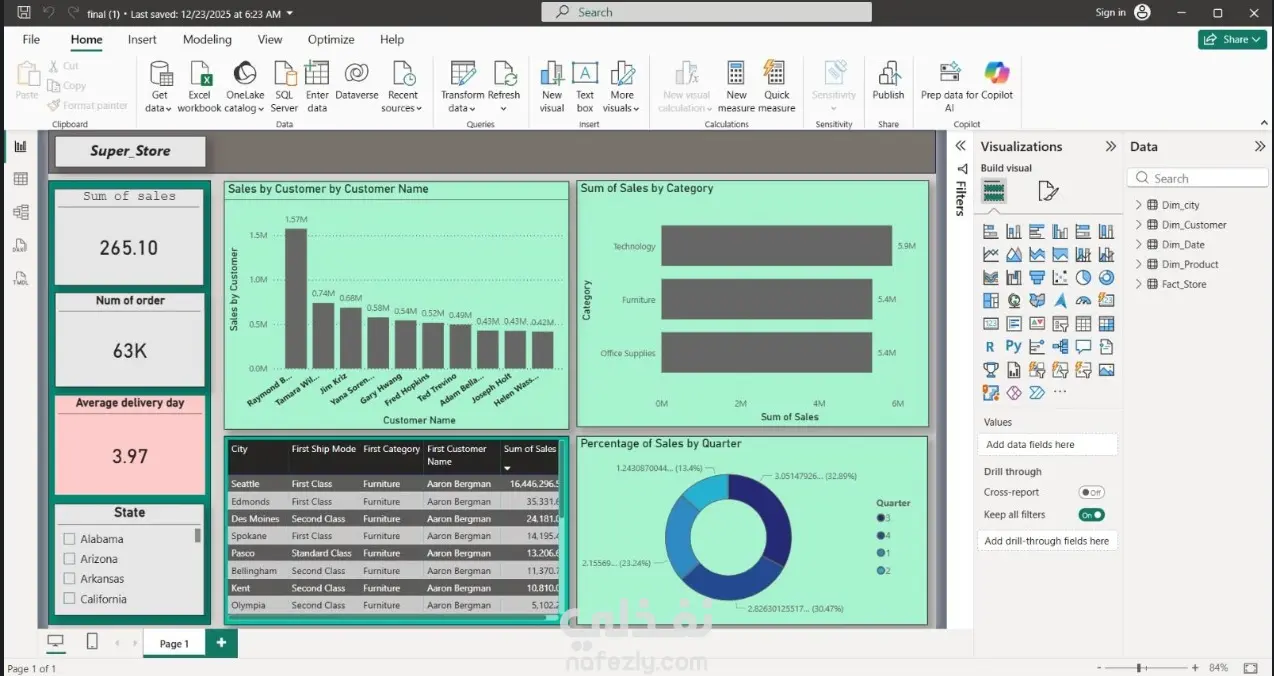
The dashboard features real-time KPIs including total sales revenue a significant number of orders and an optimized average delivery time. Key visualizations provide deep insights into customer behavior category performance and seasonal trends. For example the sales by customer chart identifies top performing customers while the category analysis shows Technology leading in sales followed by Furniture and Office Supplies. The quarterly sales breakdown reveals a notable increase in the third quarter highlighting critical seasonal patterns. Operational details such as city-specific sales ship modes and customer names are fully filterable allowing teams to uncover granular trends like consistent high sales from specific customers across multiple locations.
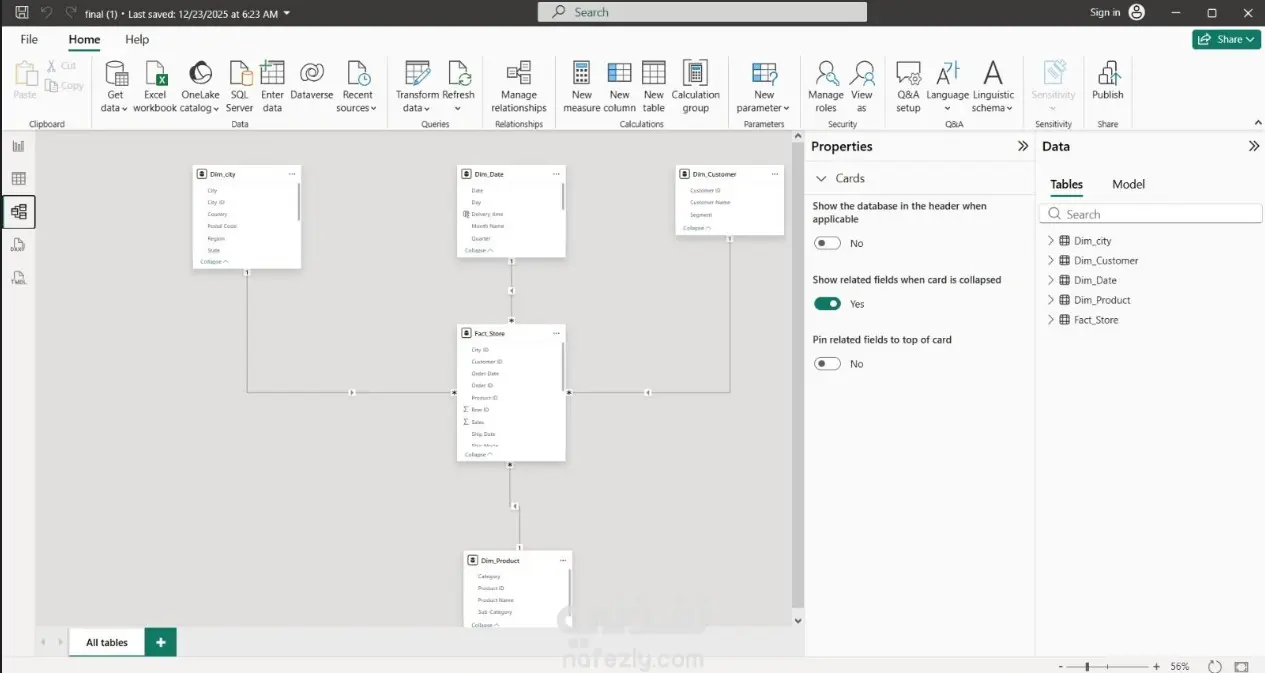
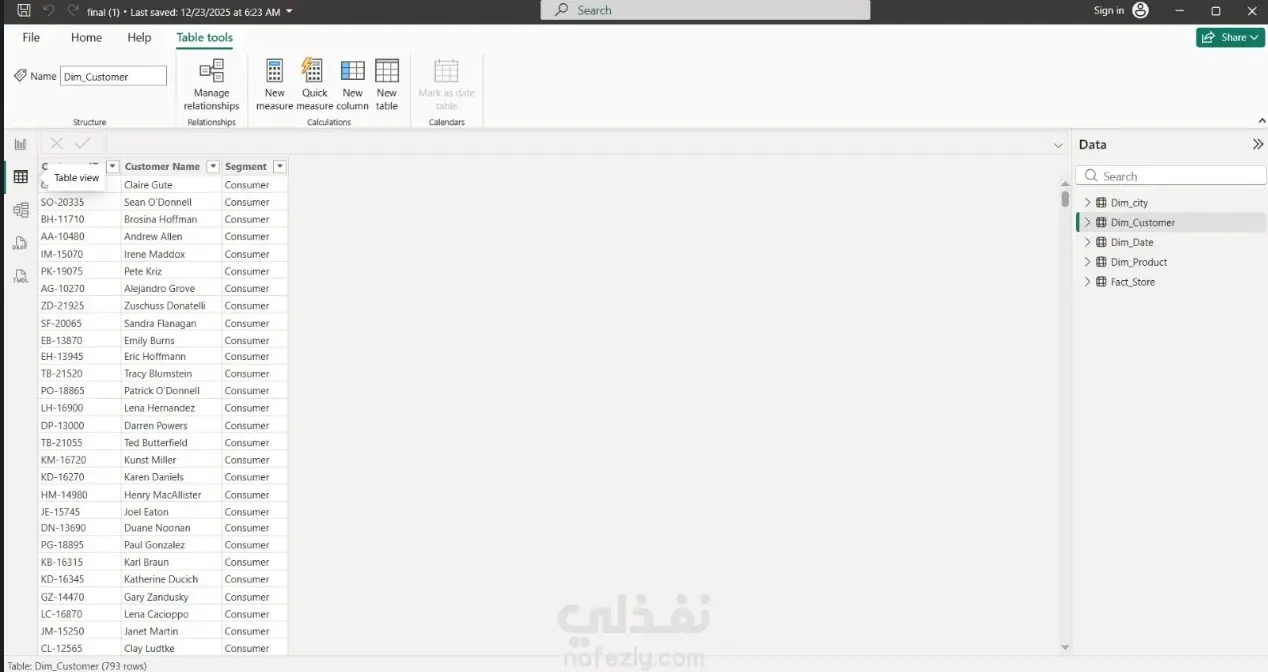
At the core of this solution is a robust star schema data model integrating key tables including the main sales fact table customer dimension table date dimension table city dimension table and product dimension table. These relationships ensure accurate aggregations and enable drill-through capabilities for detailed analysis. The model supports scalability and can seamlessly incorporate additional data sources for future growth.
This project demonstrates how structured data analysis directly impacts business strategy. Retail teams can use these insights to prioritize high-value customers optimize inventory based on category trends reduce delivery delays and ultimately drive profitability. The dashboard transforms customer records into clear action plans with a single click.
Built using Microsoft Power BI this solution leverages advanced DAX calculations data modeling and custom visualizations to deliver a user-friendly yet powerful analytics experience. I prioritized clean data relationships and intuitive design to ensure reliability and accessibility for all users.
If you are interested in data visualization retail analytics or business intelligence connect with me to discuss how data-driven approaches can elevate your organization. Let me know your biggest analytics challenge in the comments I would be glad to share insights.