Sales Dashboard – Excel Data Analysis Project
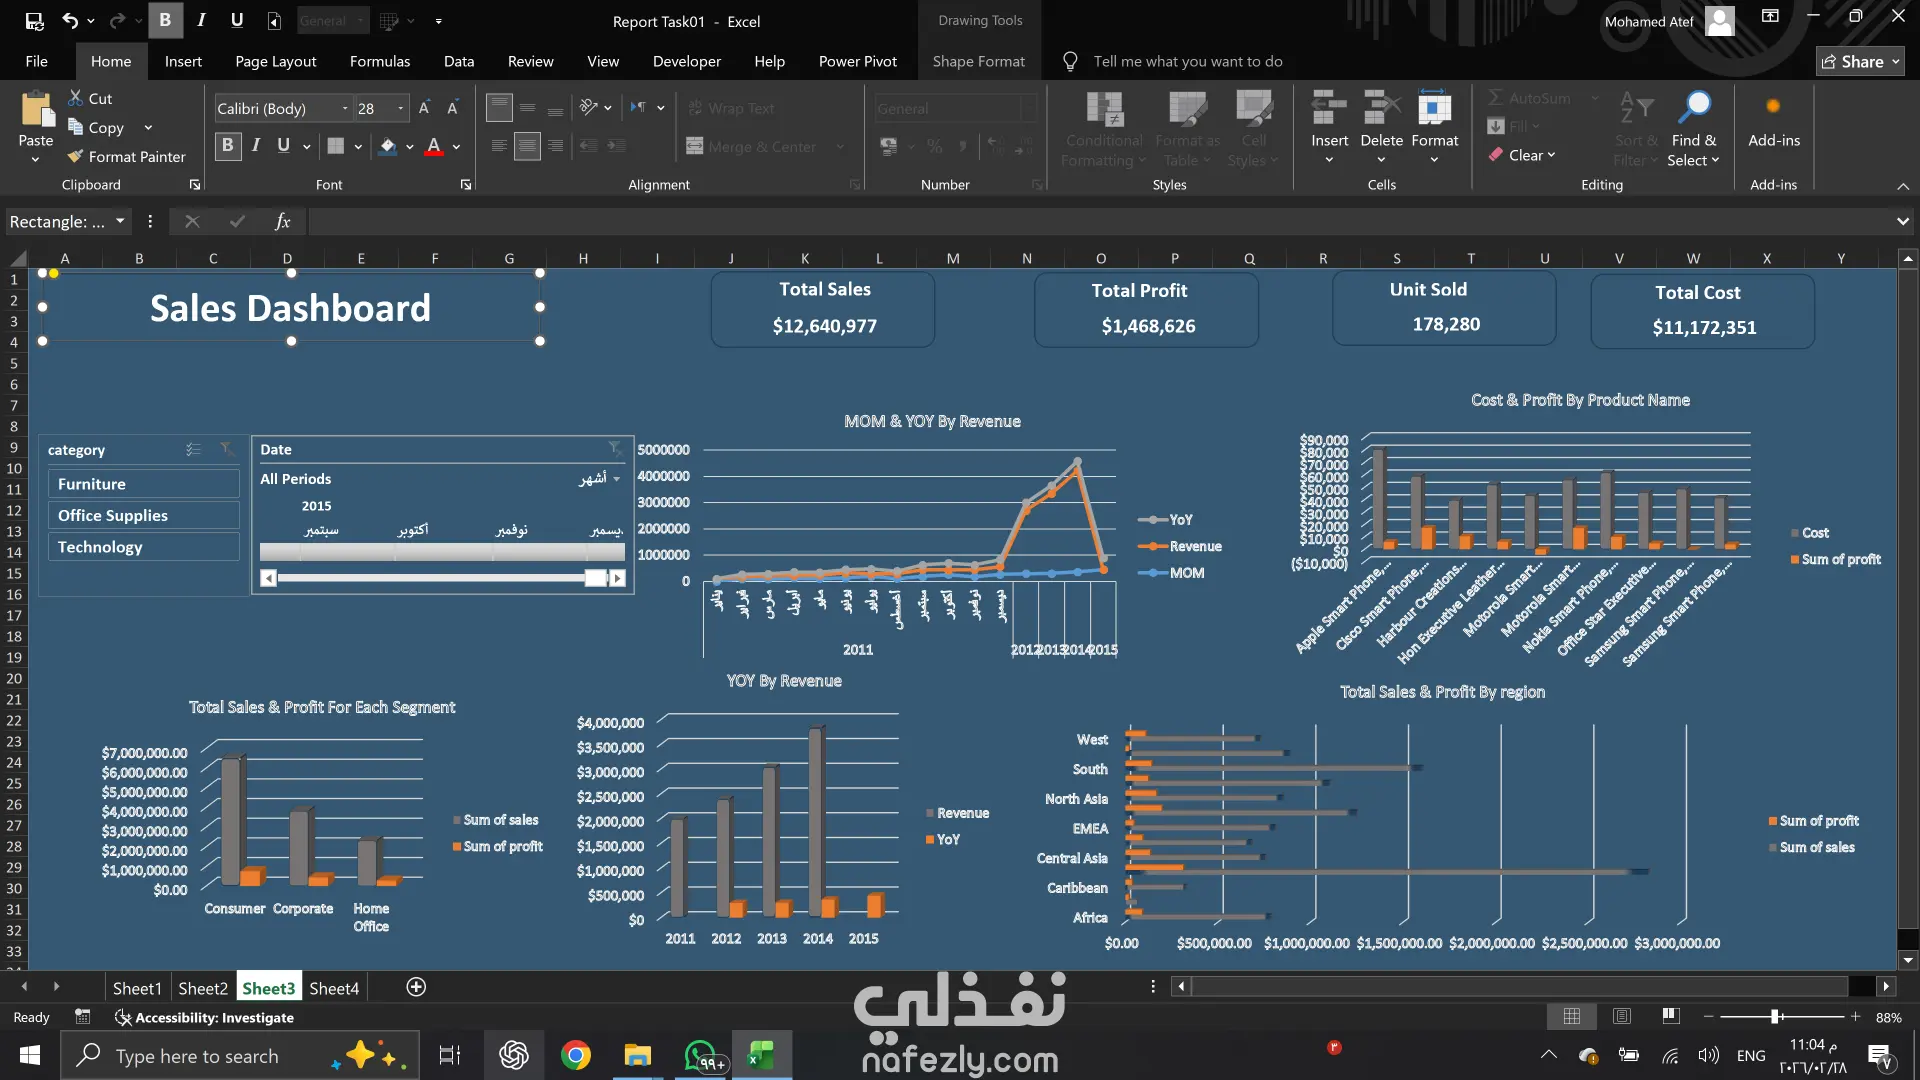
This project focuses on building an interactive Sales Performance Dashboard using Excel to analyze business performance and support data-driven decisions.
The dashboard includes key performance indicators such as Total Sales, Total Profit, Units Sold, and Total Cost. It also provides multiple analytical views including Month-over-Month (MoM) and Year-over-Year (YoY) revenue analysis, allowing users to track business growth over time.
Interactive filters and slicers were implemented to enable dynamic analysis by product category and date, giving users the ability to explore sales trends easily.
Additionally, the dashboard visualizes sales and profit by segment, region, and product, helping identify high-performing products and profitable markets.
Key skills used in this project include:
Data Cleaning and Preparation
Pivot Tables & Pivot Charts
Interactive Dashboards
Slicers & Filters
Business Performance Analysis
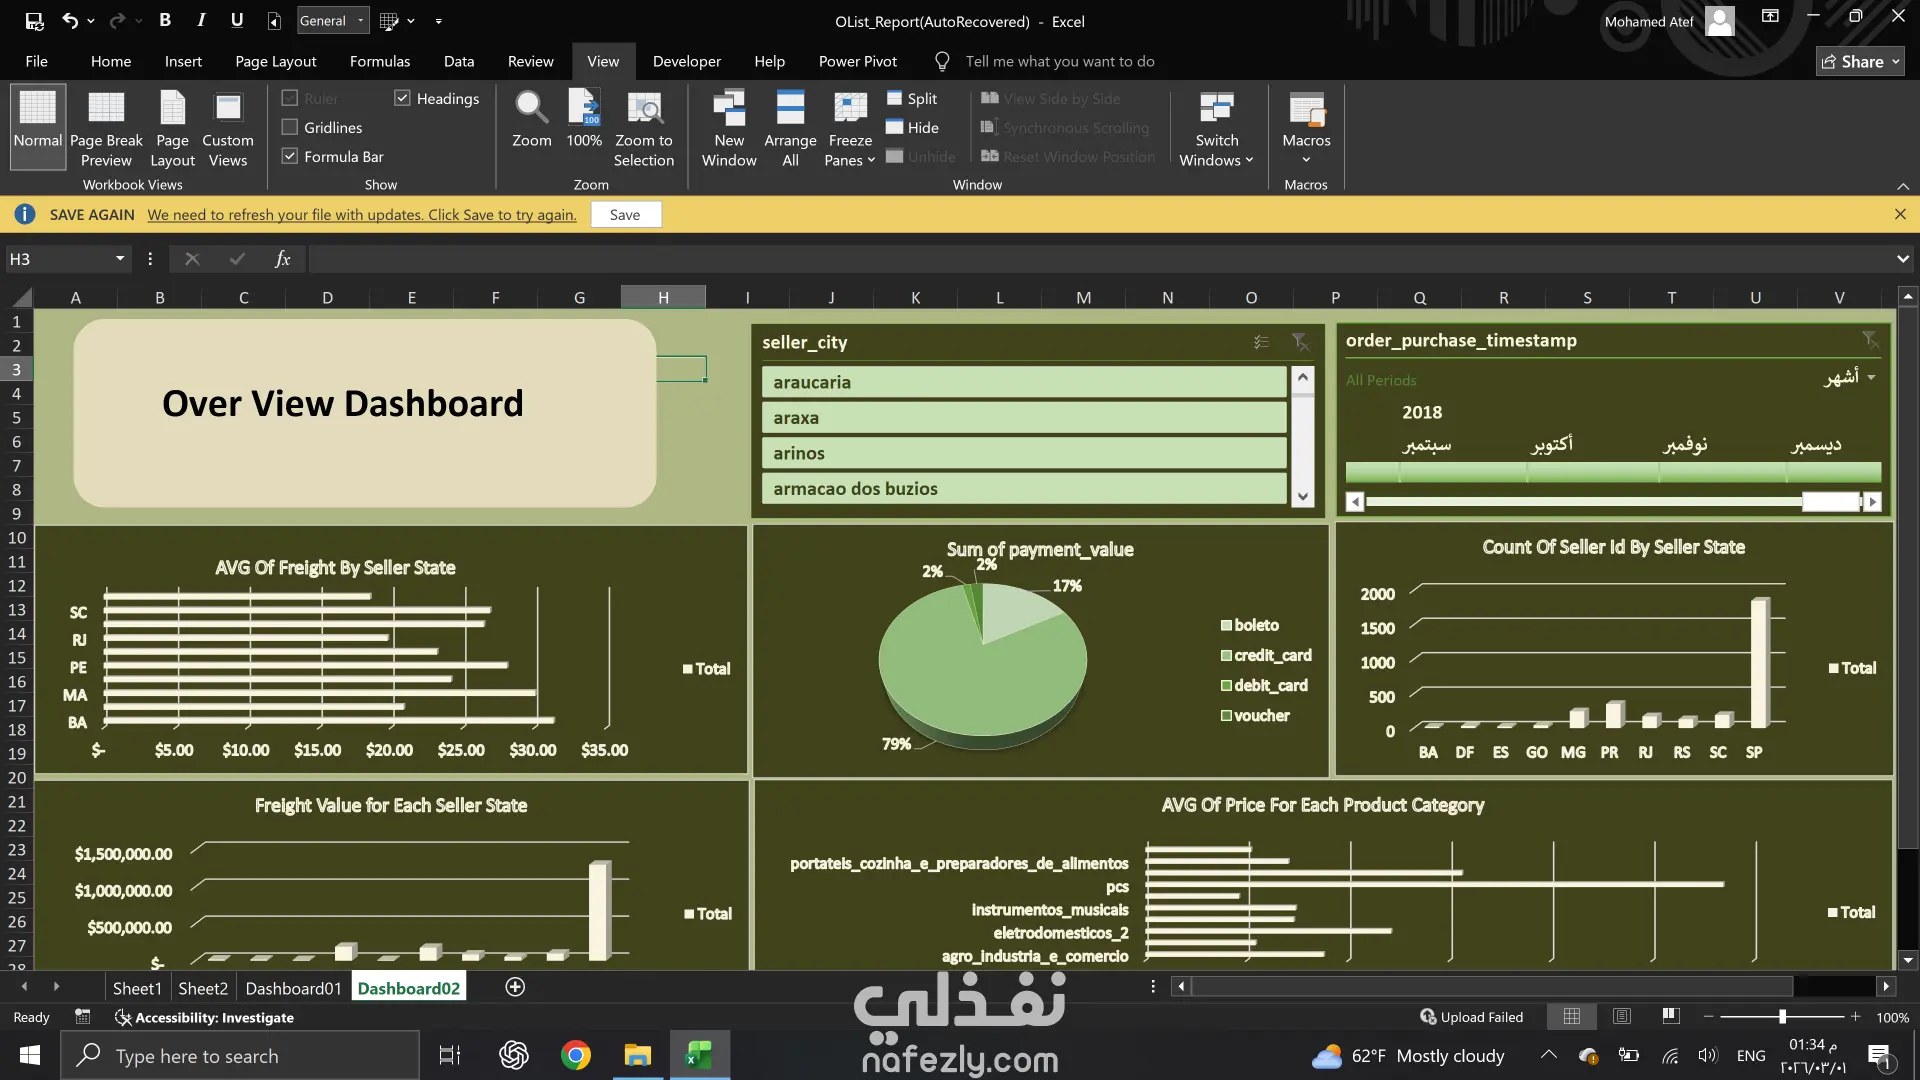
E-Commerce Data Analysis Dashboard
This project analyzes e-commerce marketplace data to extract valuable insights about sellers, payments, freight costs, and product categories.
The dashboard highlights important insights such as:
Average freight cost by seller state
Payment method distribution
Seller distribution across states
Freight value per state
Average product price by category
Interactive filters allow users to analyze the data based on seller city and purchase date, making the dashboard flexible for deeper analysis.
This project demonstrates strong skills in:
Exploratory Data Analysis (EDA)
Business Insights Extraction
Dashboard Design
Data Visualization
Excel Analytics Techniques