SALES PERFORMANCE DASHBOARD – MICROSOFT EXCEL
تفاصيل العمل
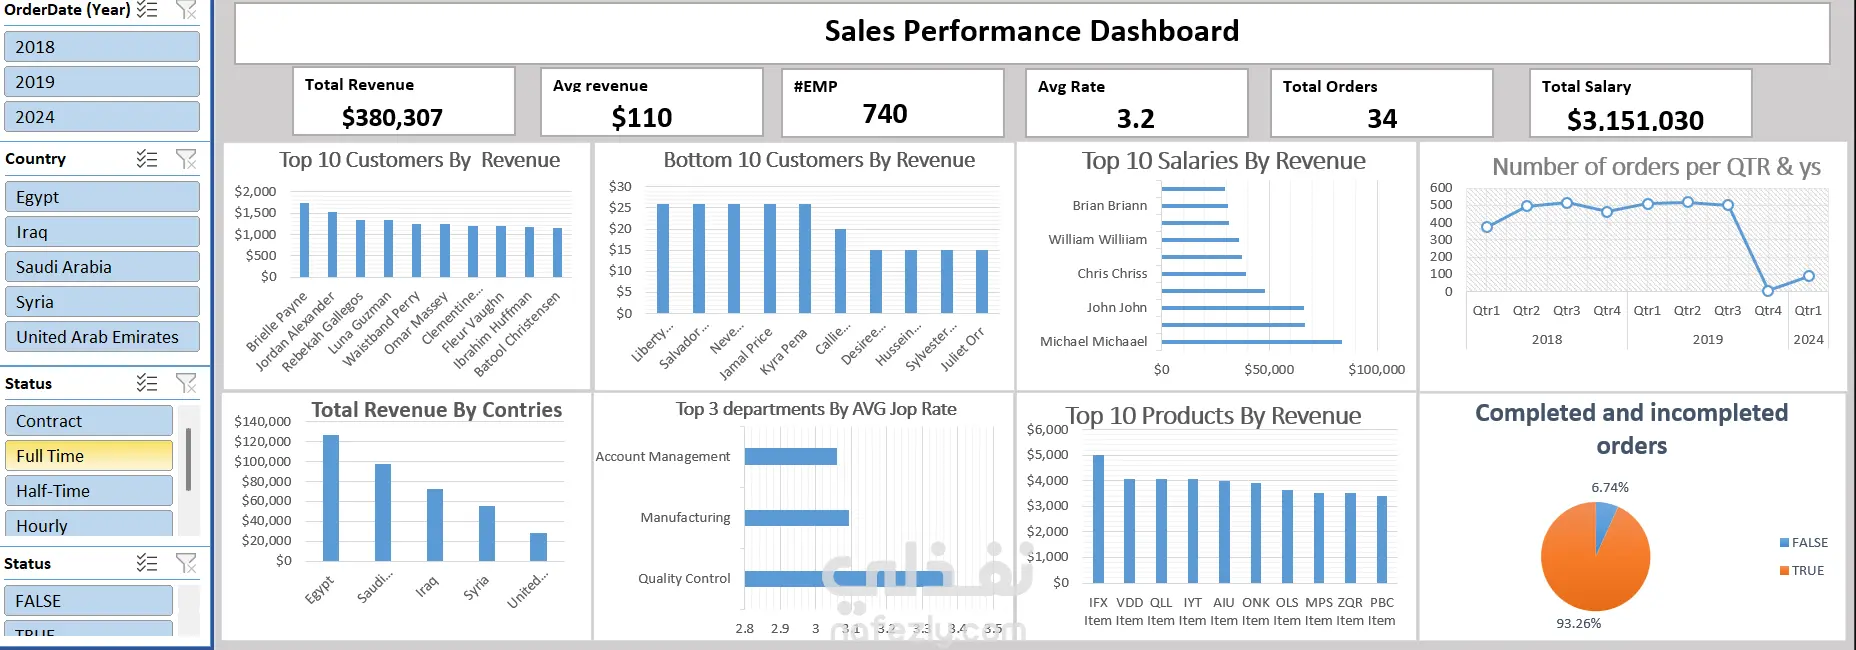
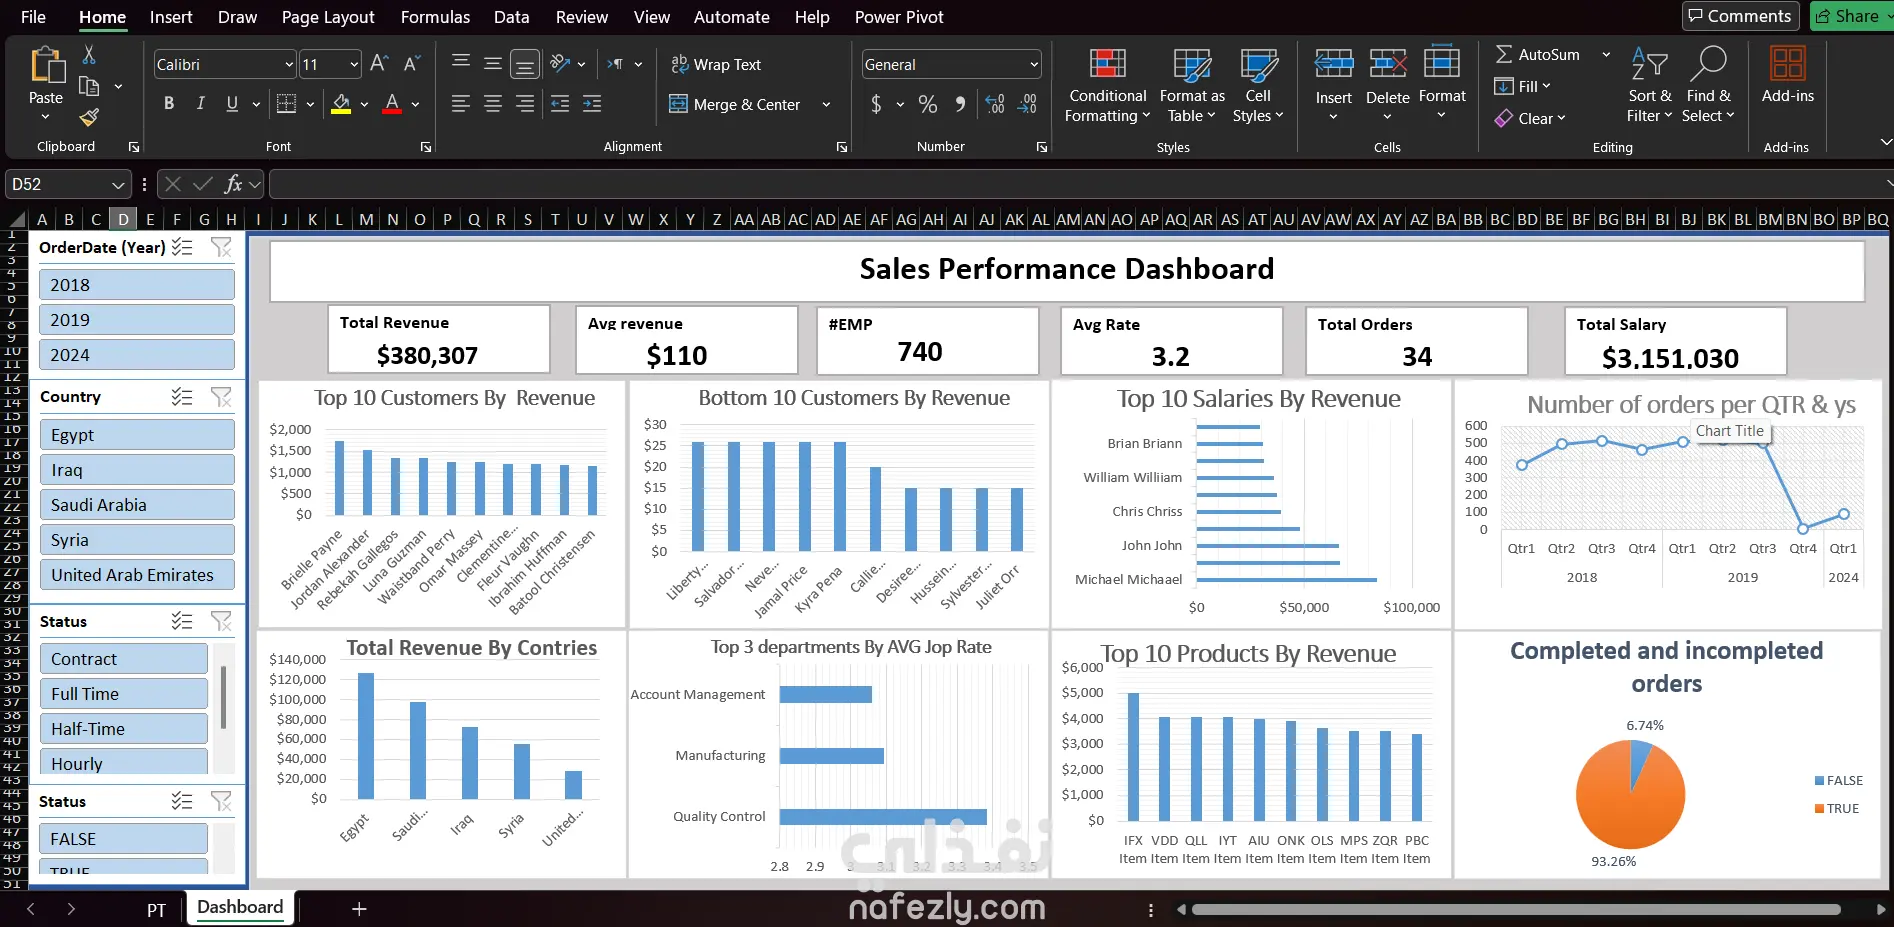
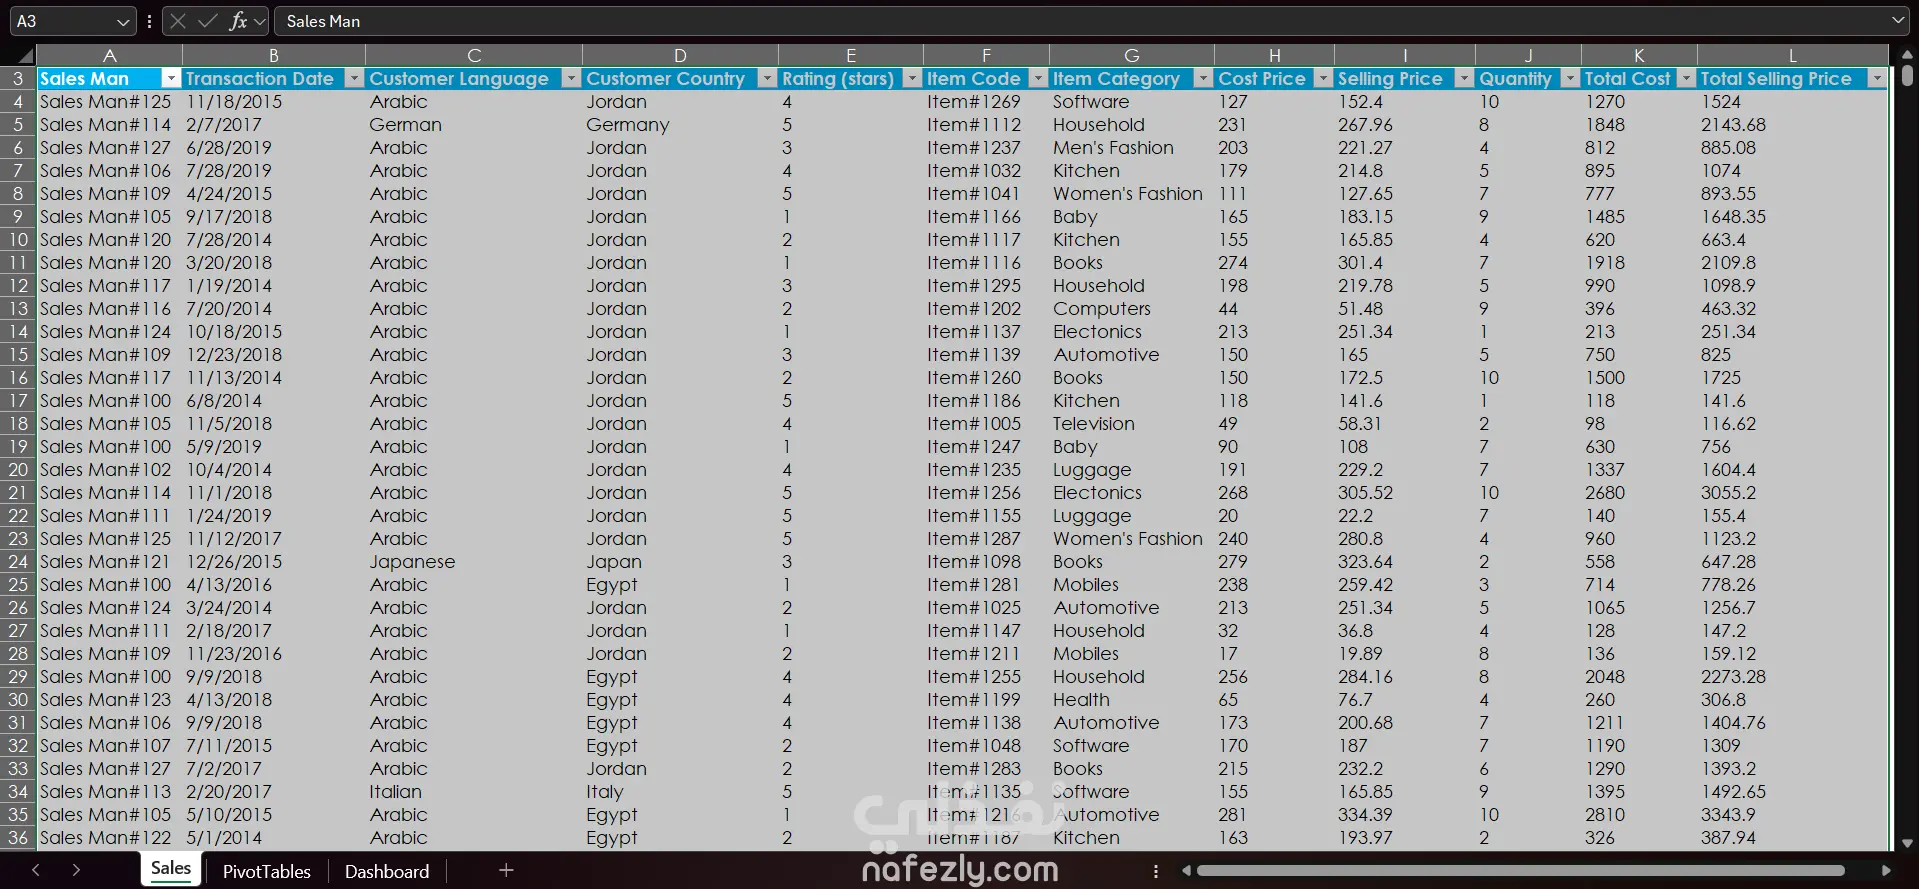
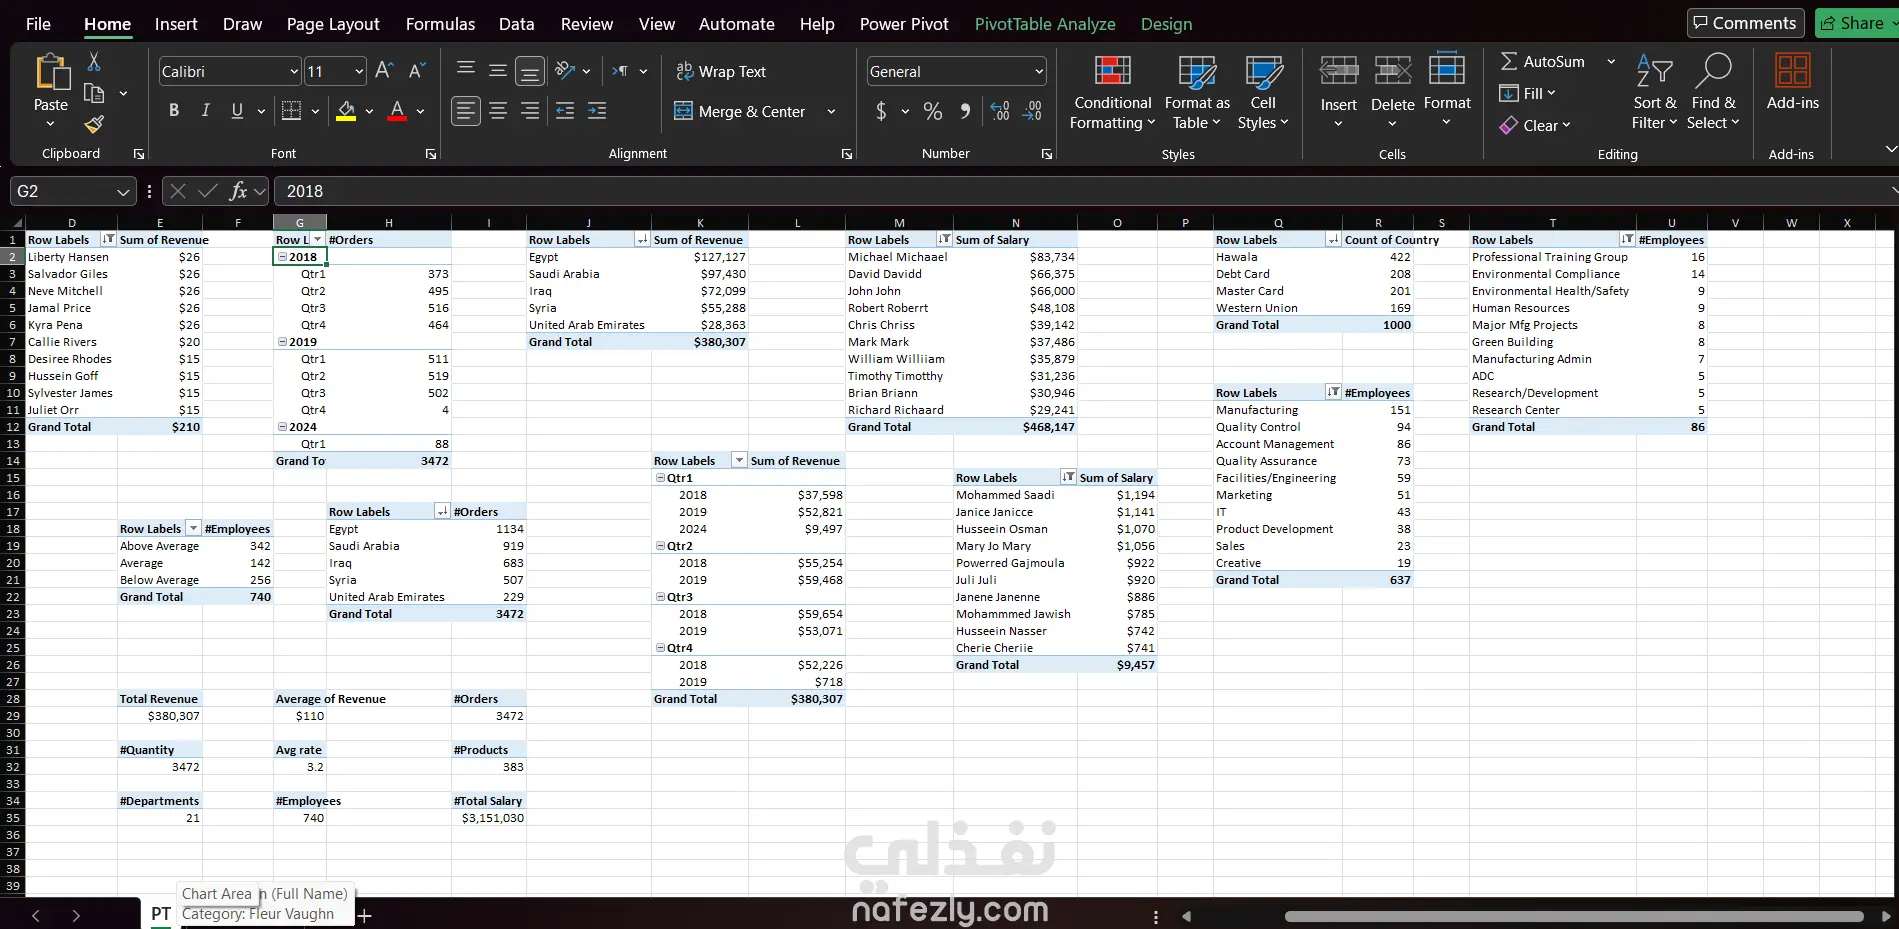
Designed an interactive sales performance dashboard to track key KPIs (total revenue, average revenue, total orders, and quantities sold) Used Pivot Tables, Pivot Charts, and Slicers to analyze sales by country, year, order status, and employment type Created visualizations using bar charts, line charts, pie charts, and KPI cards to support business decision-making Identified top customers and products and analyzed quarterly sales trends Tools: Power Query, Power Pivot, Slicers, Timeline
مهارات العمل