Comprehensive Business Performance
تفاصيل العمل
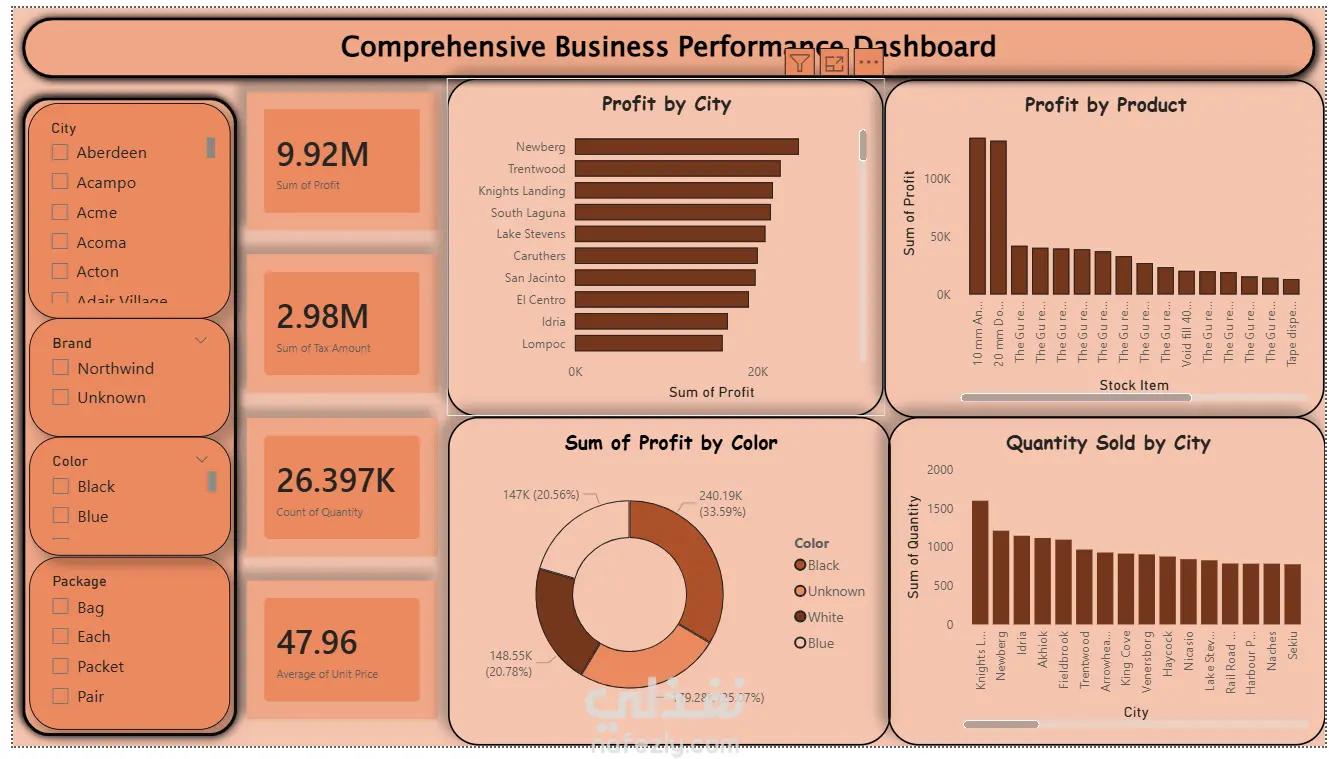
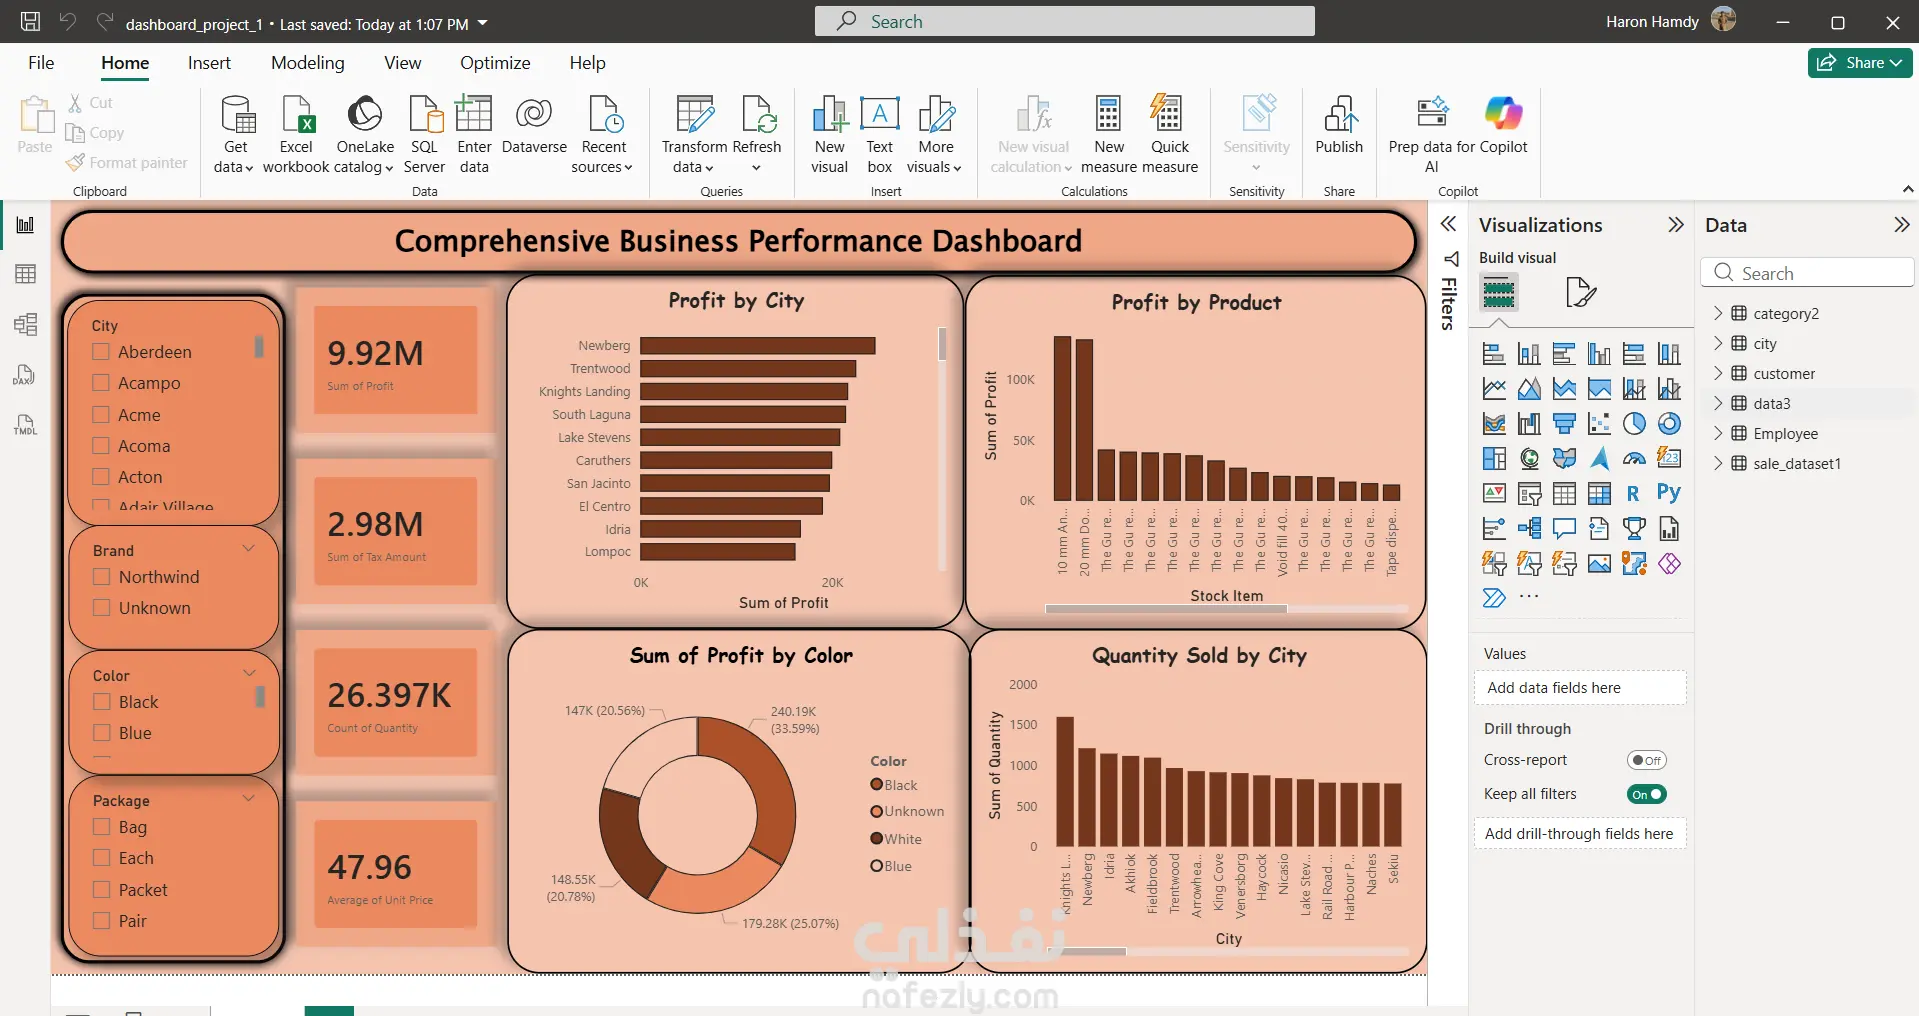
This Power BI dashboard provides a detailed overview of business performance across cities, brands, and products. It visualizes key metrics such as profit by city, tax amount, quantity sold, and profit by product and color. Key features include: Total profit and tax amounts by city Insights on top-selling products and profits Quantity sold by city for regional trends Product distribution by color and unit price Designed for quick and informed business decisions, this dashboard highlights key performance indicators and trends.
مهارات العمل
بطاقة العمل

طلب عمل مماثل


