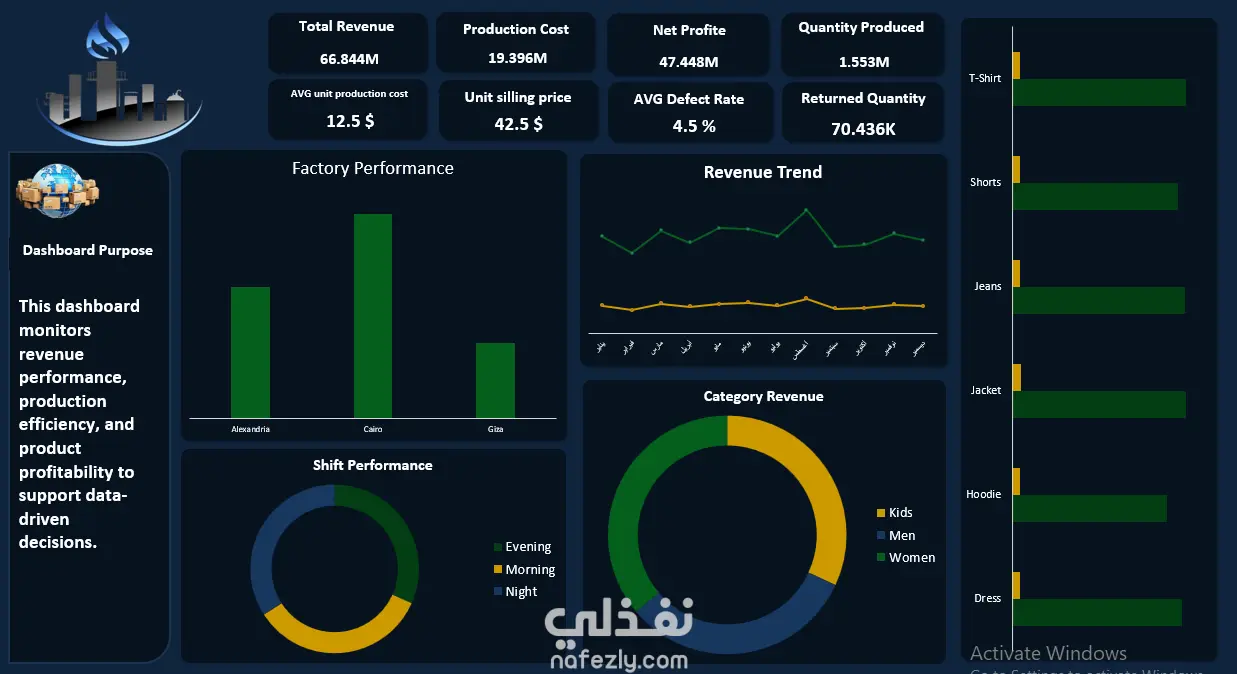
This project presents an interactive Factory Performance Dashboard built in Excel to analyze revenue, production cost, profitability, and operational efficiency.
The dashboard provides clear insights into financial performance, product profitability, defect rates, and production shifts to support data-driven decision-making.
Key Features
Revenue & Profit Analysis
Production Cost Monitoring
Net Profit Calculation
Monthly Revenue Trend
Product Category Performance
Shift Performance Analysis
Defect Rate & Returned Quantity Tracking
Business Value
This dashboard helps factory managers and business owners:
Identify top-performing products
Monitor production efficiency
Analyze cost structure
Track profitability trends
Improve operational decision-making