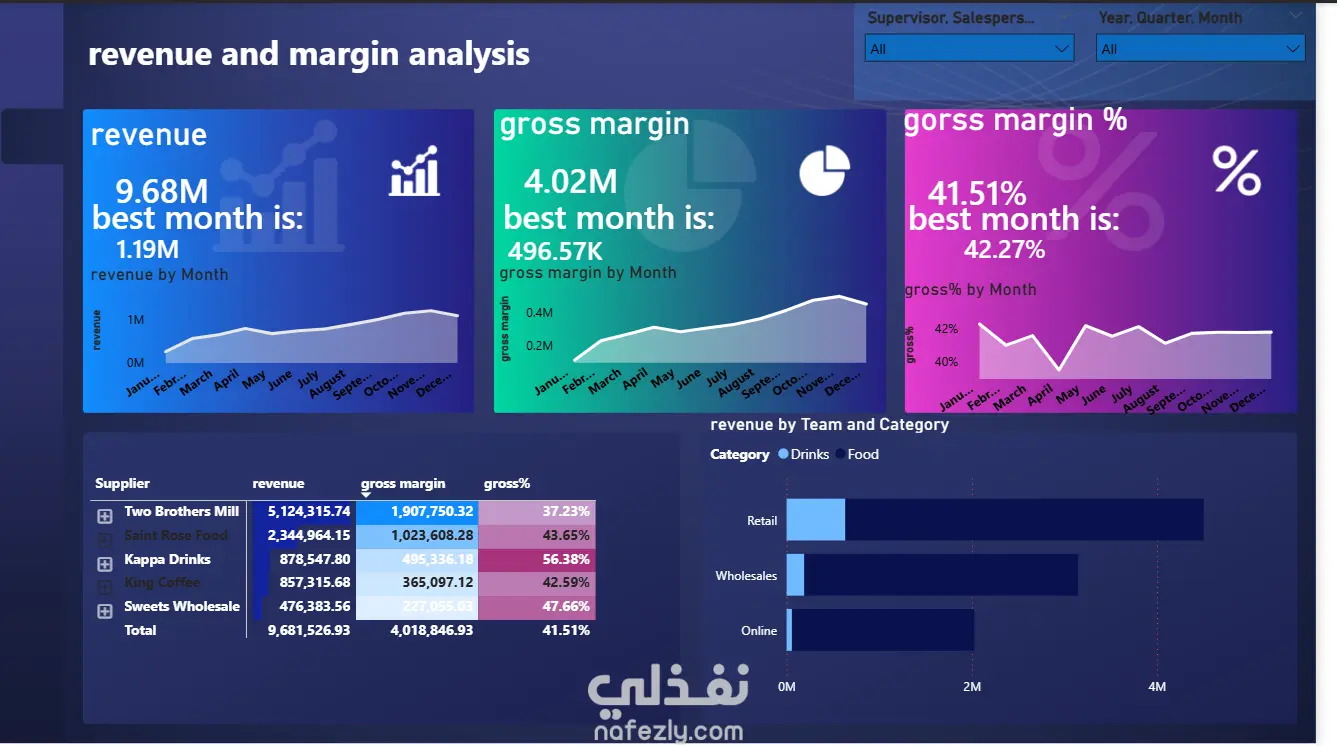
Revenue and Margin Analysis Dashboard – Power BI
This dashboard provides a detailed analysis of revenue and profit margins to help evaluate business profitability and financial performance. Built using Power BI, the dashboard transforms raw sales data into clear visual insights that support strategic decision-making.
The report analyzes how revenue translates into profit by comparing total revenue with costs to determine the profit margin for products, categories, or time periods. Interactive visuals allow users to explore which products generate the highest revenue and which contribute the most to overall profitability.
The dashboard helps identify high-margin products, detect areas with lower profitability, and understand trends over time. These insights enable businesses to optimize pricing strategies, control costs, and improve financial performance.
Key Features
Total Revenue Overview
Profit Margin Analysis
Revenue by Product and Category
Profitability Trends Over Time
Top and Low Margin Products
Interactive Filters and Visualizations
The relationship between revenue and margin is commonly analyzed in business analytics to understand profitability and operational efficiency.