Revenue, Target, and Achievement Dashboard


تفاصيل العمل
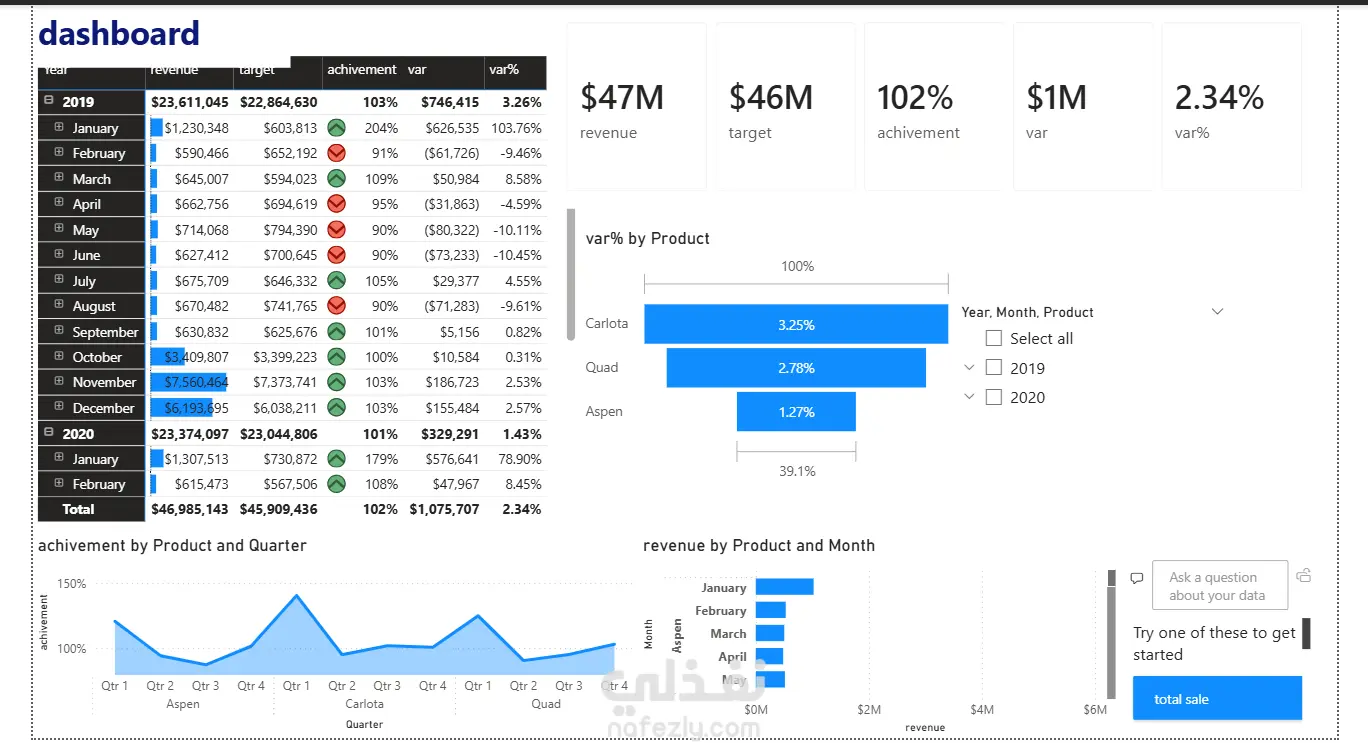
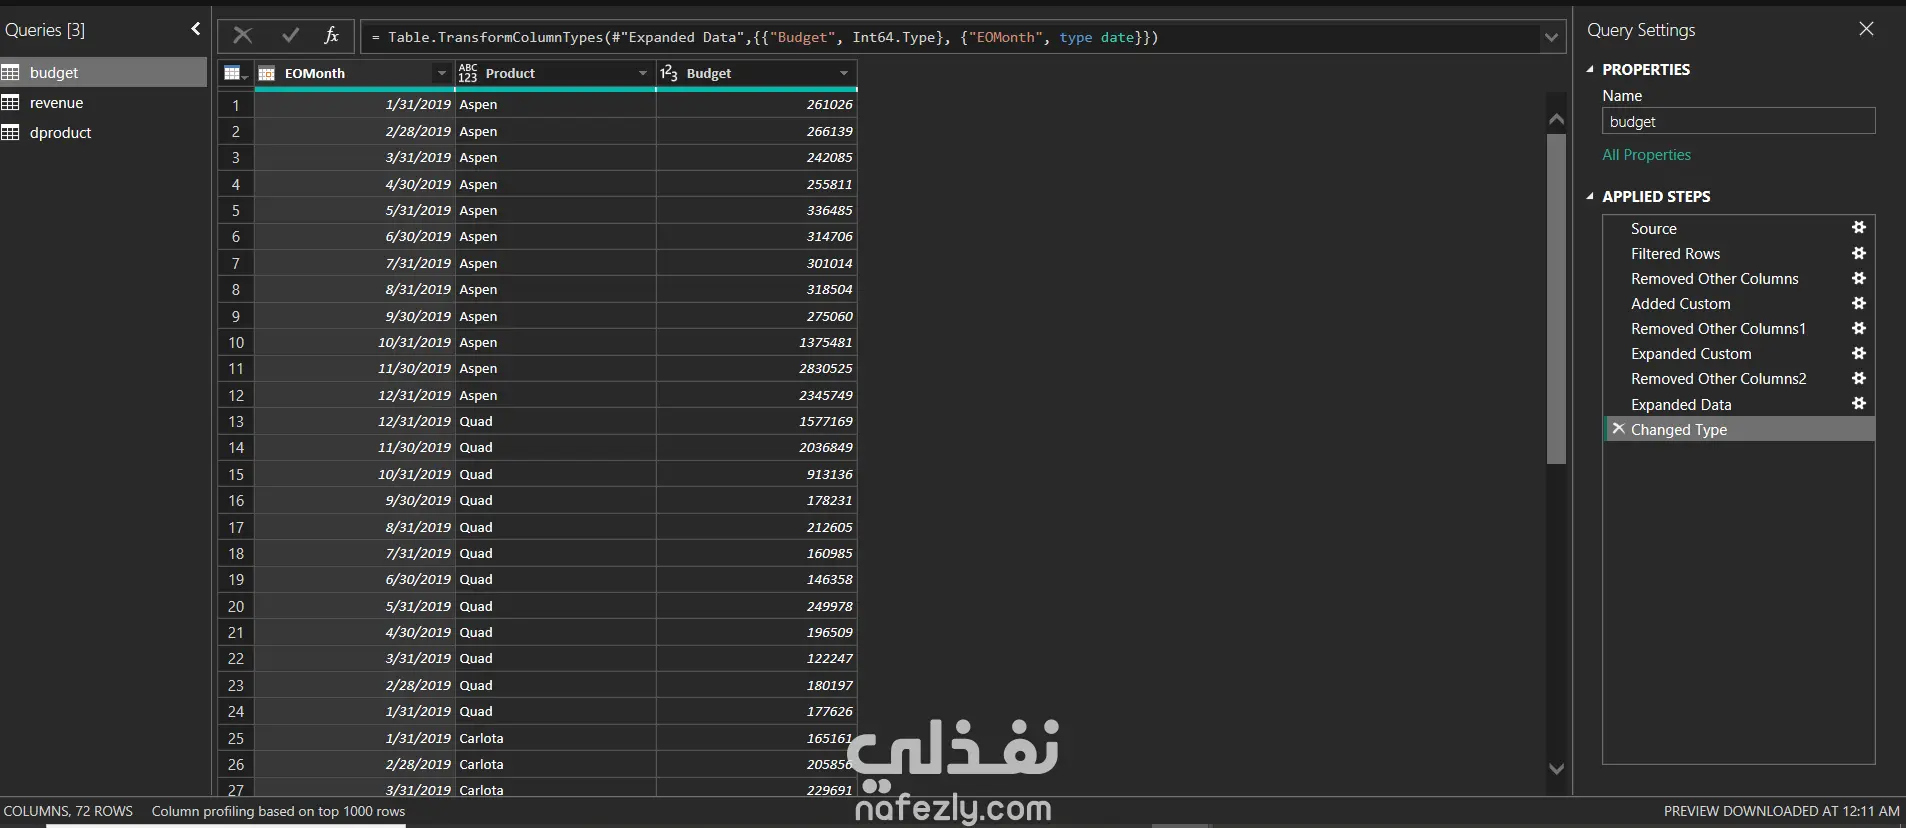
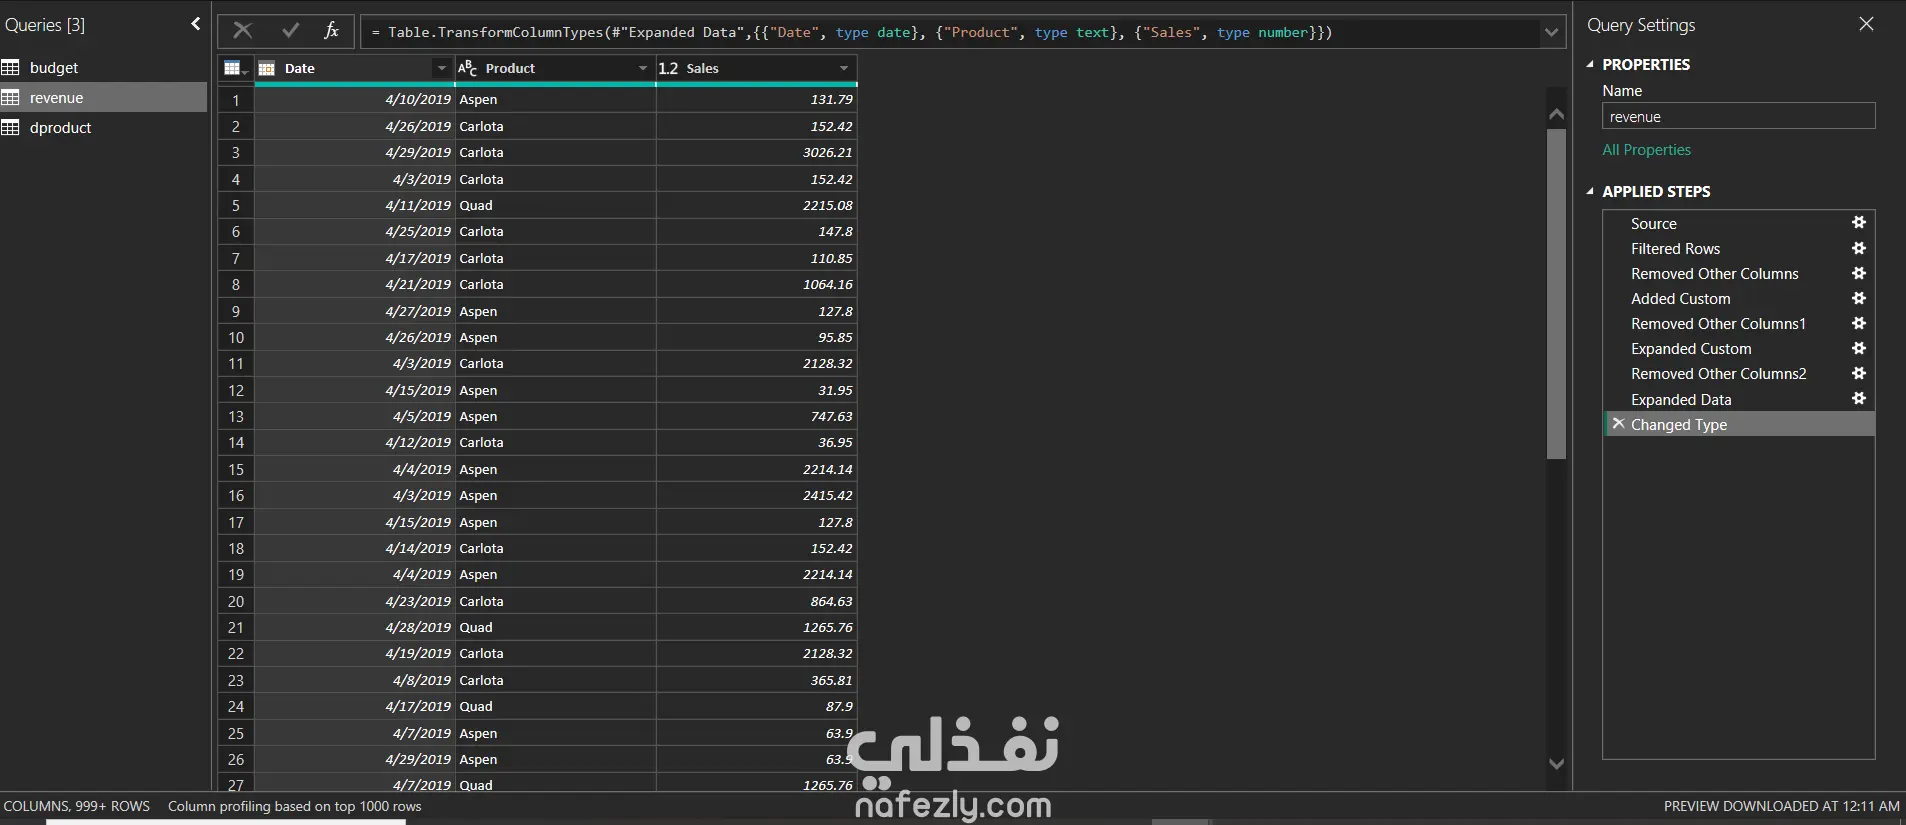
Revenue, Target, and Achievement Dashboard – Power BI This dashboard analyzes revenue performance compared to targets to help evaluate business success and track progress toward financial goals. Built using Power BI, the dashboard provides a clear overview of how actual revenue performs against planned targets. The data is prepared and transformed using Power Query, ensuring accuracy and consistency before creating visual reports. The dashboard enables users to quickly identify whether targets are being met and highlights areas that require improvement. Interactive visualizations allow users to explore revenue performance by product, time period, or category, making it easier to monitor progress and make informed business decisions. Key Features Total Revenue Overview Revenue vs Target Comparison Achievement Percentage Analysis Performance Trends Over Time Interactive Filters and Visualizations Data Cleaning and Transformation using Power Query This dashboard helps businesses track their financial performance, measure achievement levels, and identify opportunities to improve revenue outcomes.
مهارات العمل