First, the sales data was entered into Microsoft Excel including customer name, product, city, and sales amount.
The entire dataset was selected including the column headers.
From the Excel menu, the Insert tab was opened and Pivot Table was selected.
In the Pivot Table dialog box, the table range was confirmed and New Worksheet was selected, then OK was clicked.
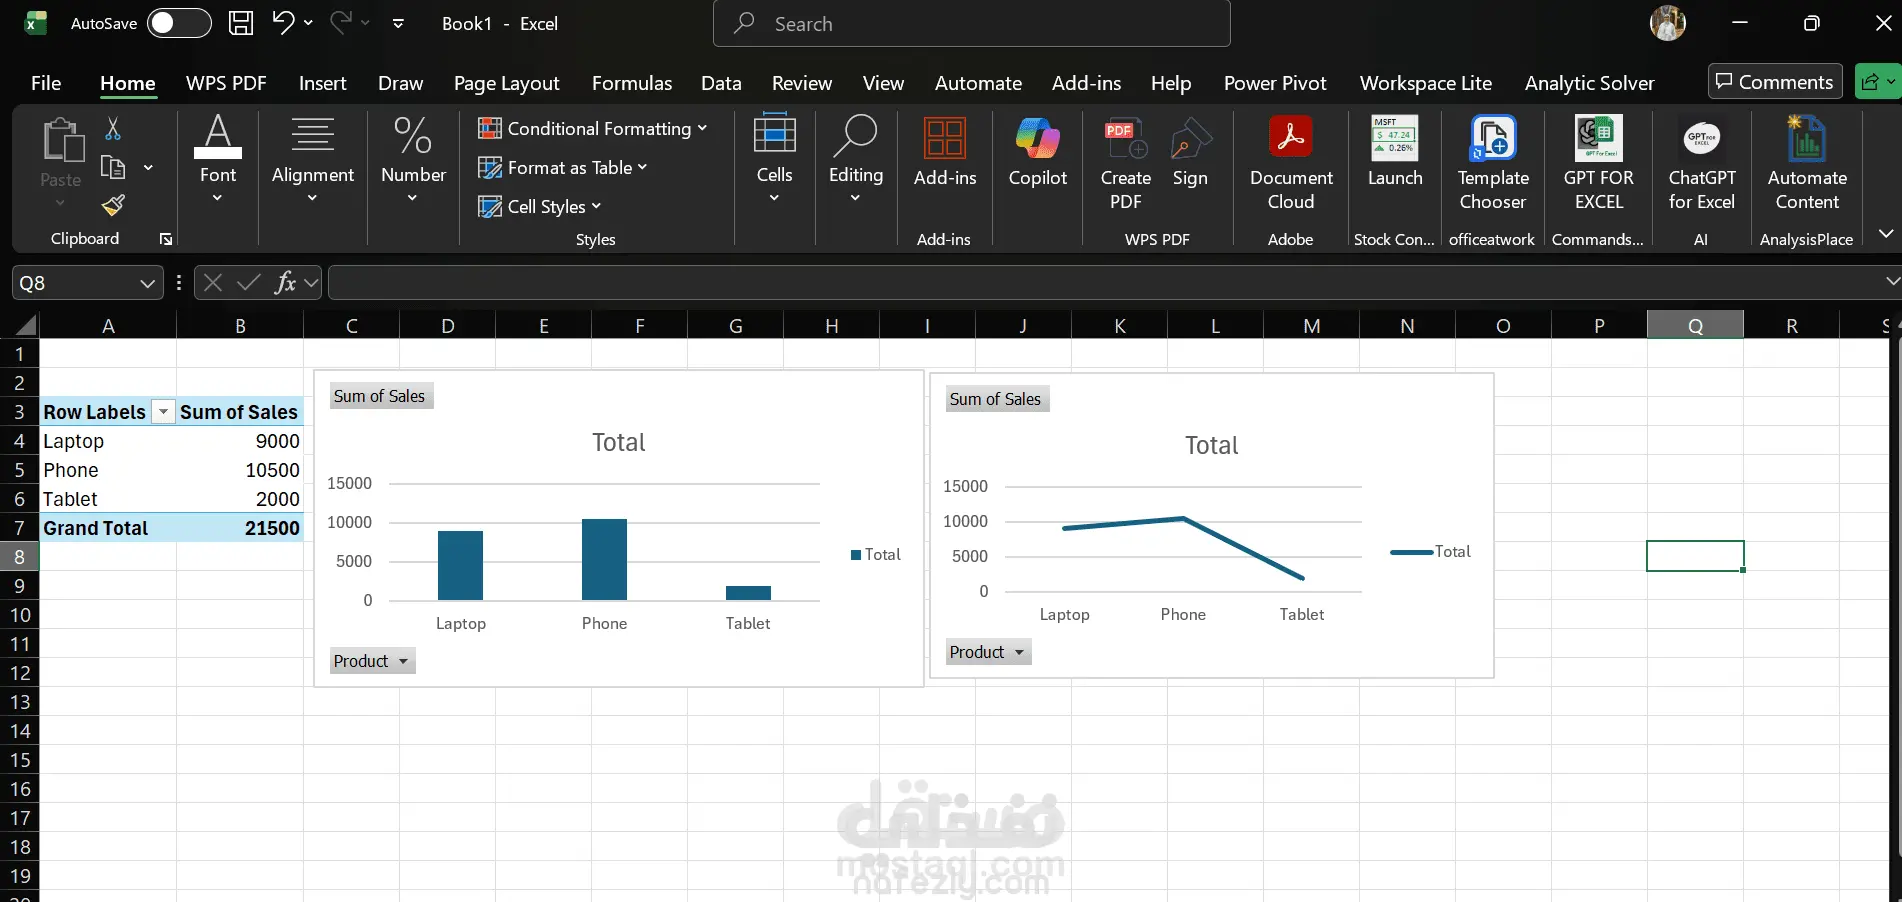
In the PivotTable Fields panel, the Product field was dragged to the Rows area.
The Sales field was dragged to the Values area to calculate the Sum of Sales.
The Pivot Table automatically summarized the total sales for each product, making it easier to analyse the data.