Sales Dashboard For Corporate Performance
تفاصيل العمل
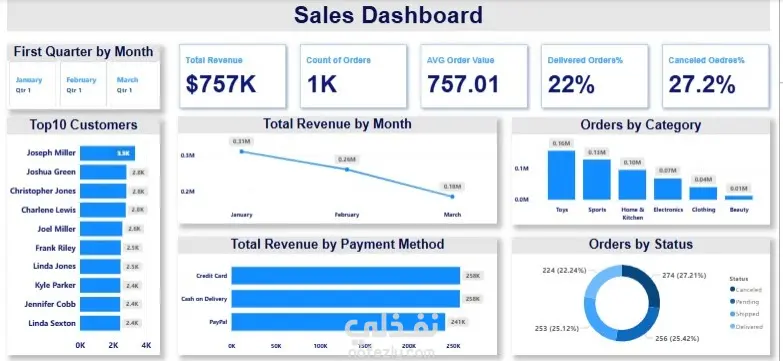
First: Cleaned and structured datasets using Power Query to optimize performance. Then: Using DAXES throw Columns and measures to calculate profitability and operational KPI's. Last step :In Power BI, we transformed the data into clear insights using dynamic charts. These visuals track: Total Revenue by Month. Total Revenue by Payment Method. Orders by Category. Orders by Status.
مهارات العمل
بطاقة العمل

طلب عمل مماثل


