Designed and developed a comprehensive Power BI dashboard to analyze sales, customer behavior, product performance, and regional trends for the AdventureWorks dataset.
The dashboard consists of four interactive pages:
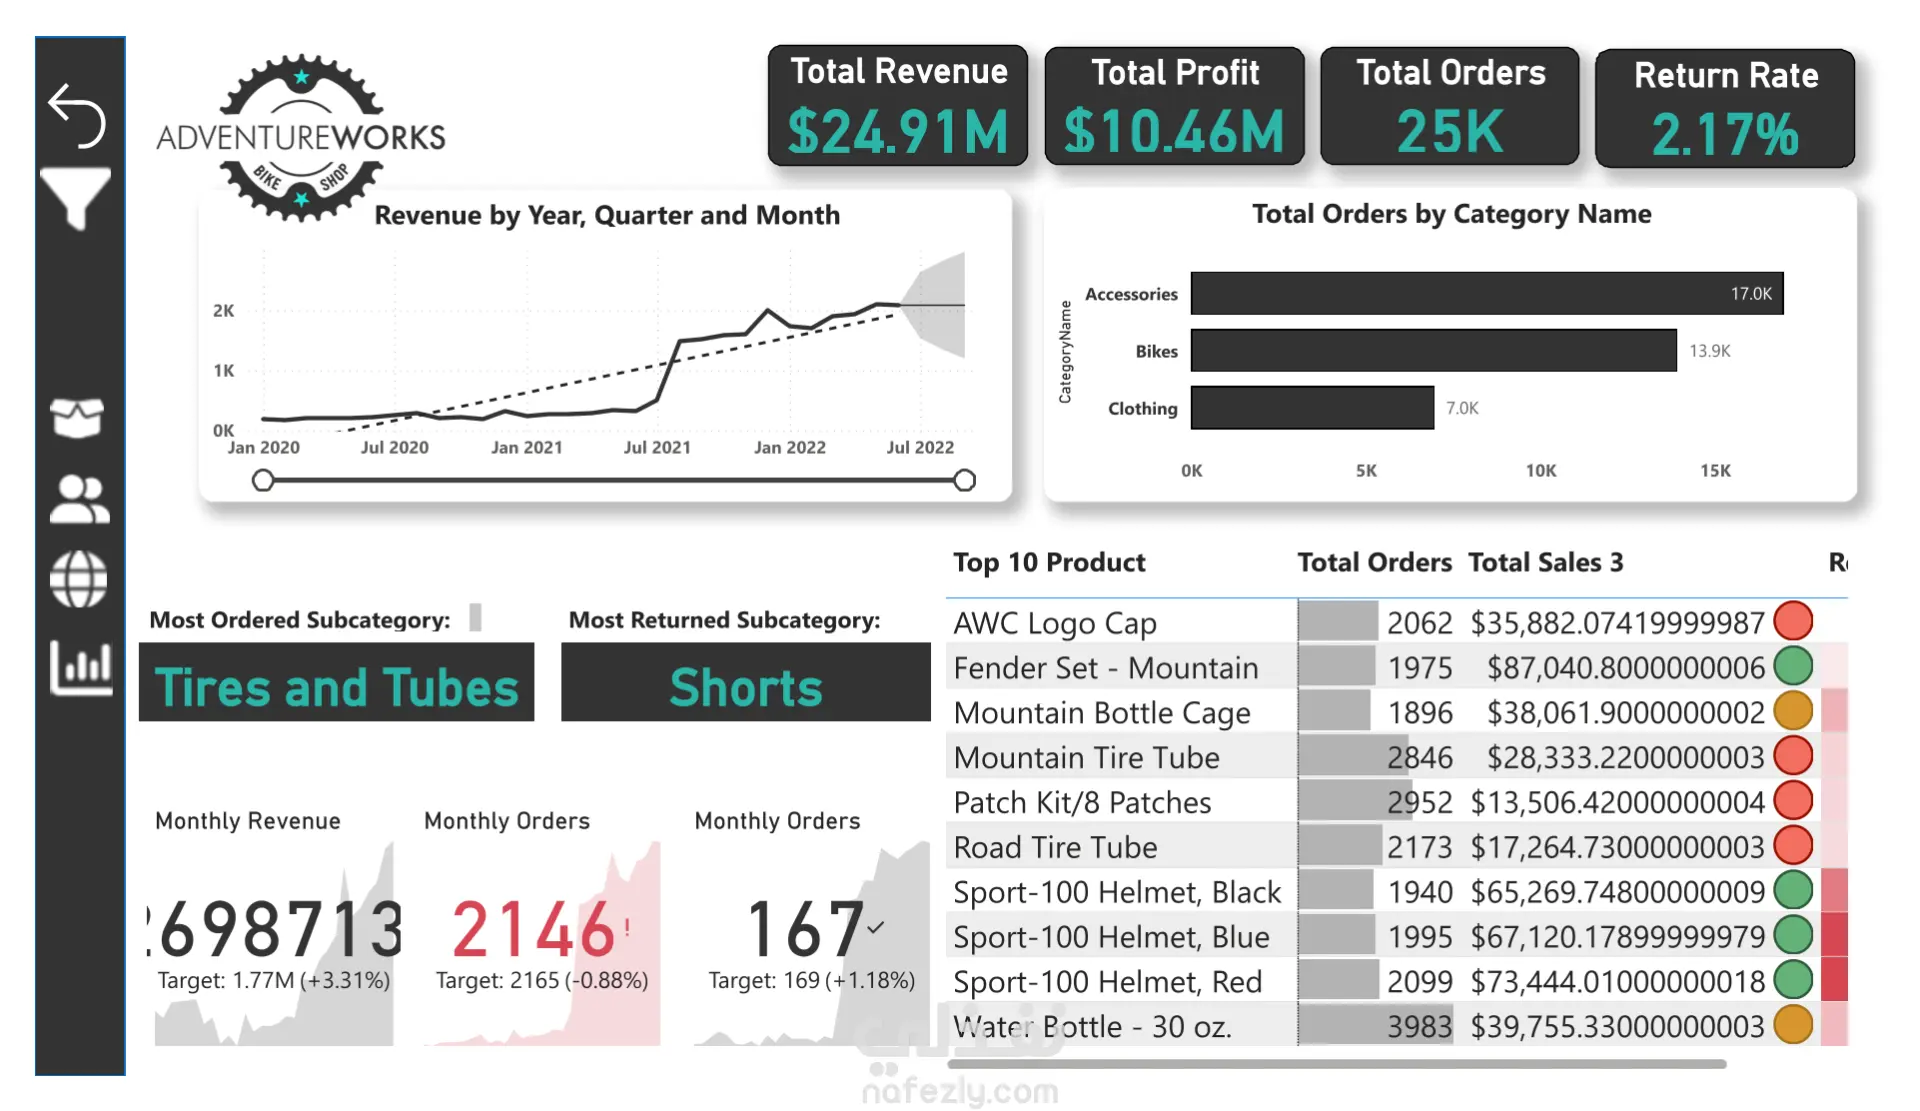
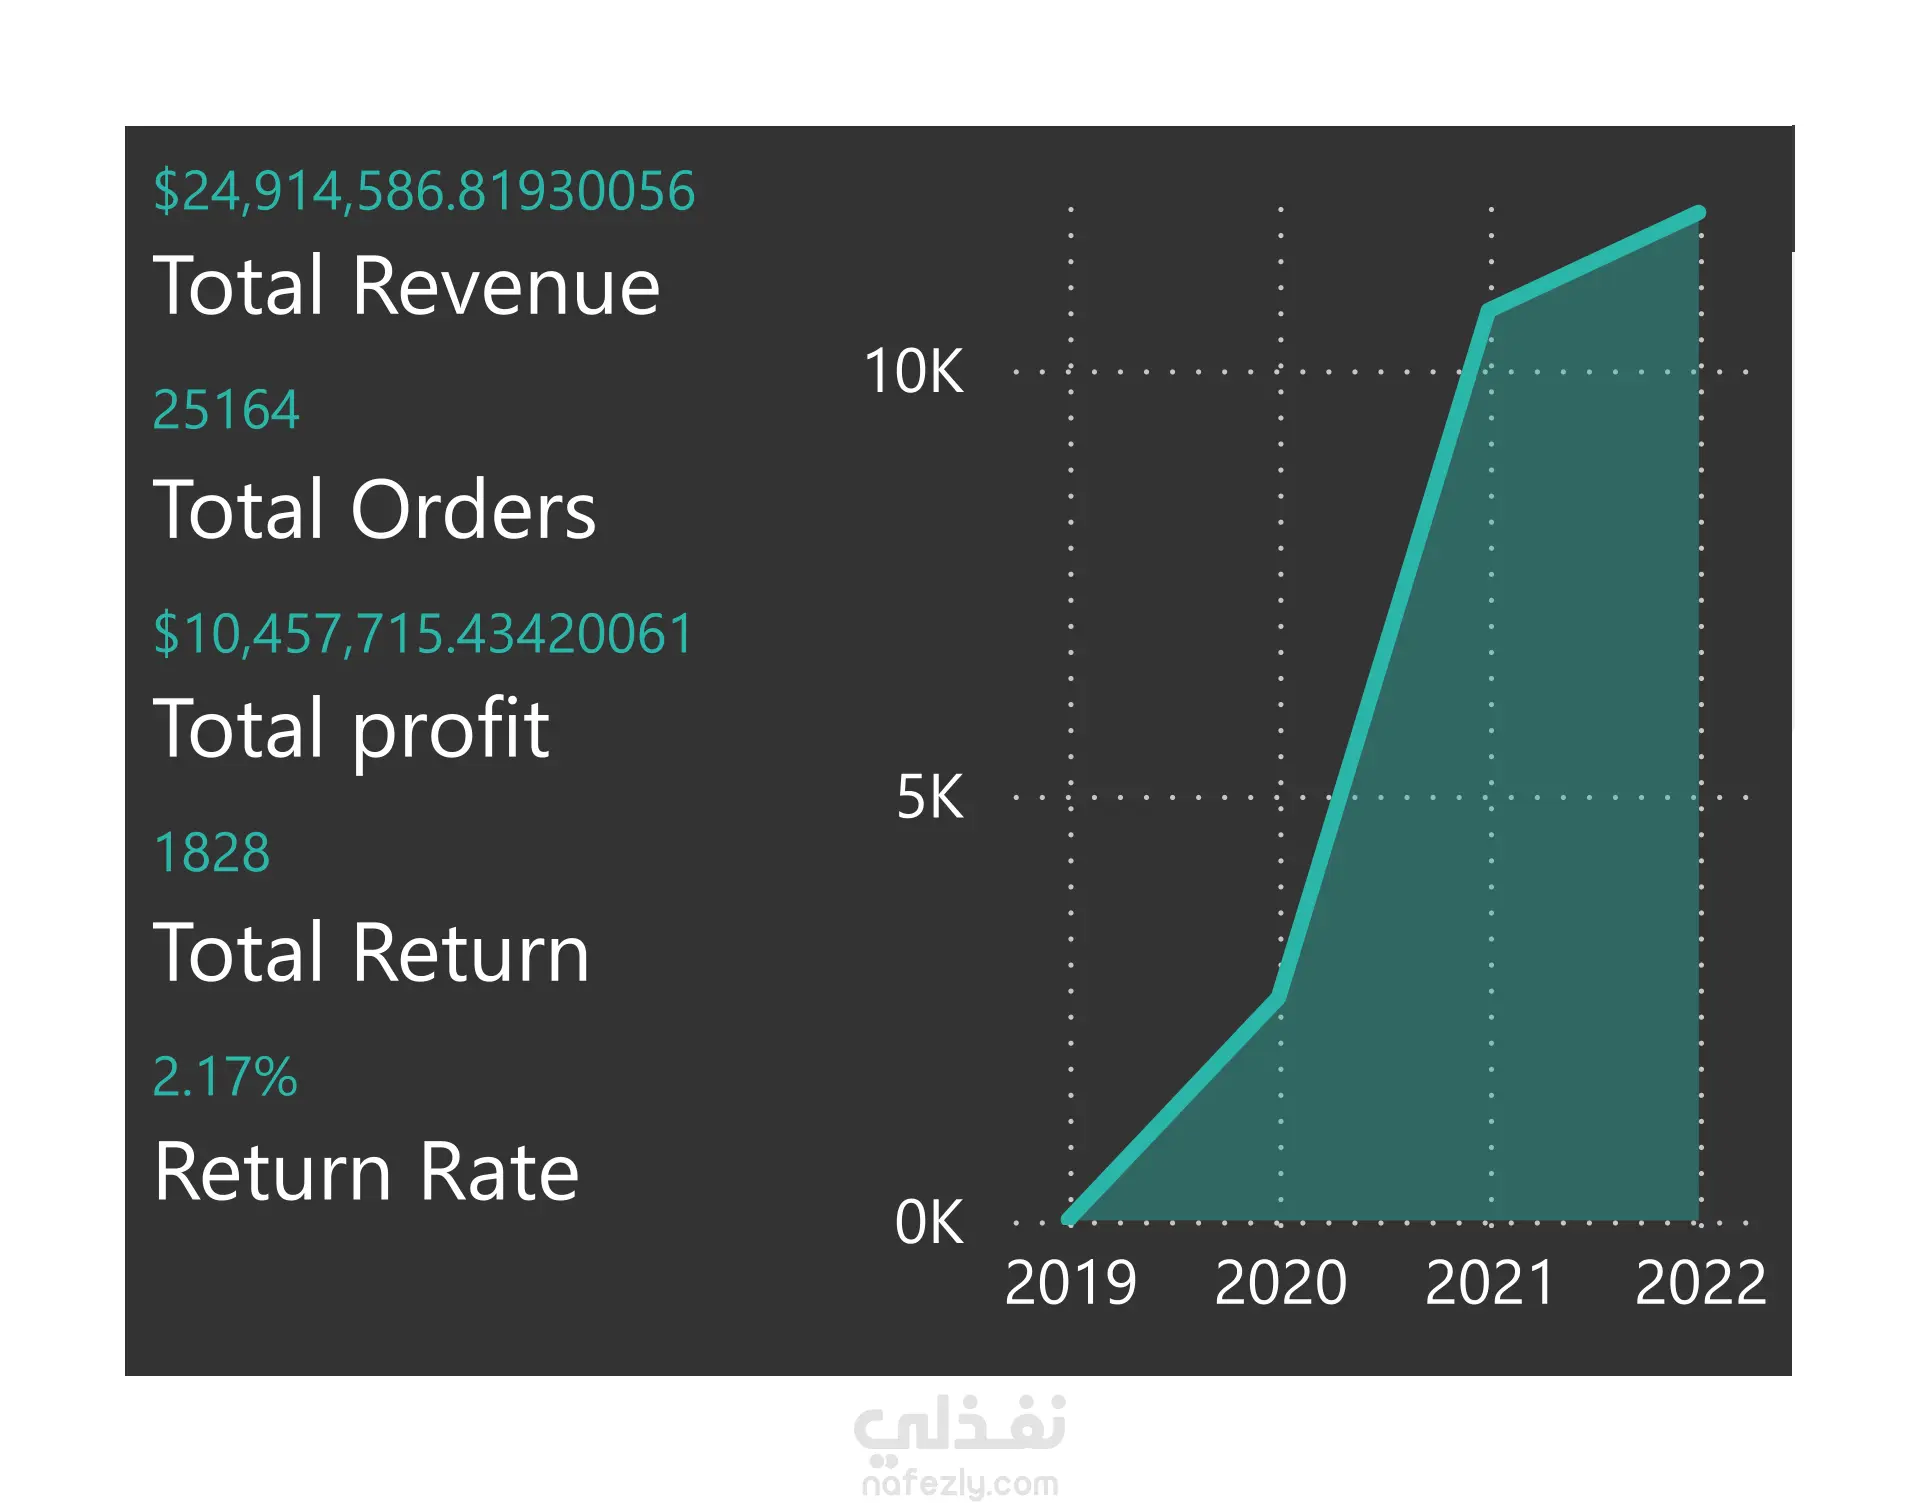
1. Executive Summary – Displays KPIs like Total Revenue, Profit, Orders, and Return Rate. Includes drillable line charts, top 10 product tables, and category-level visuals.
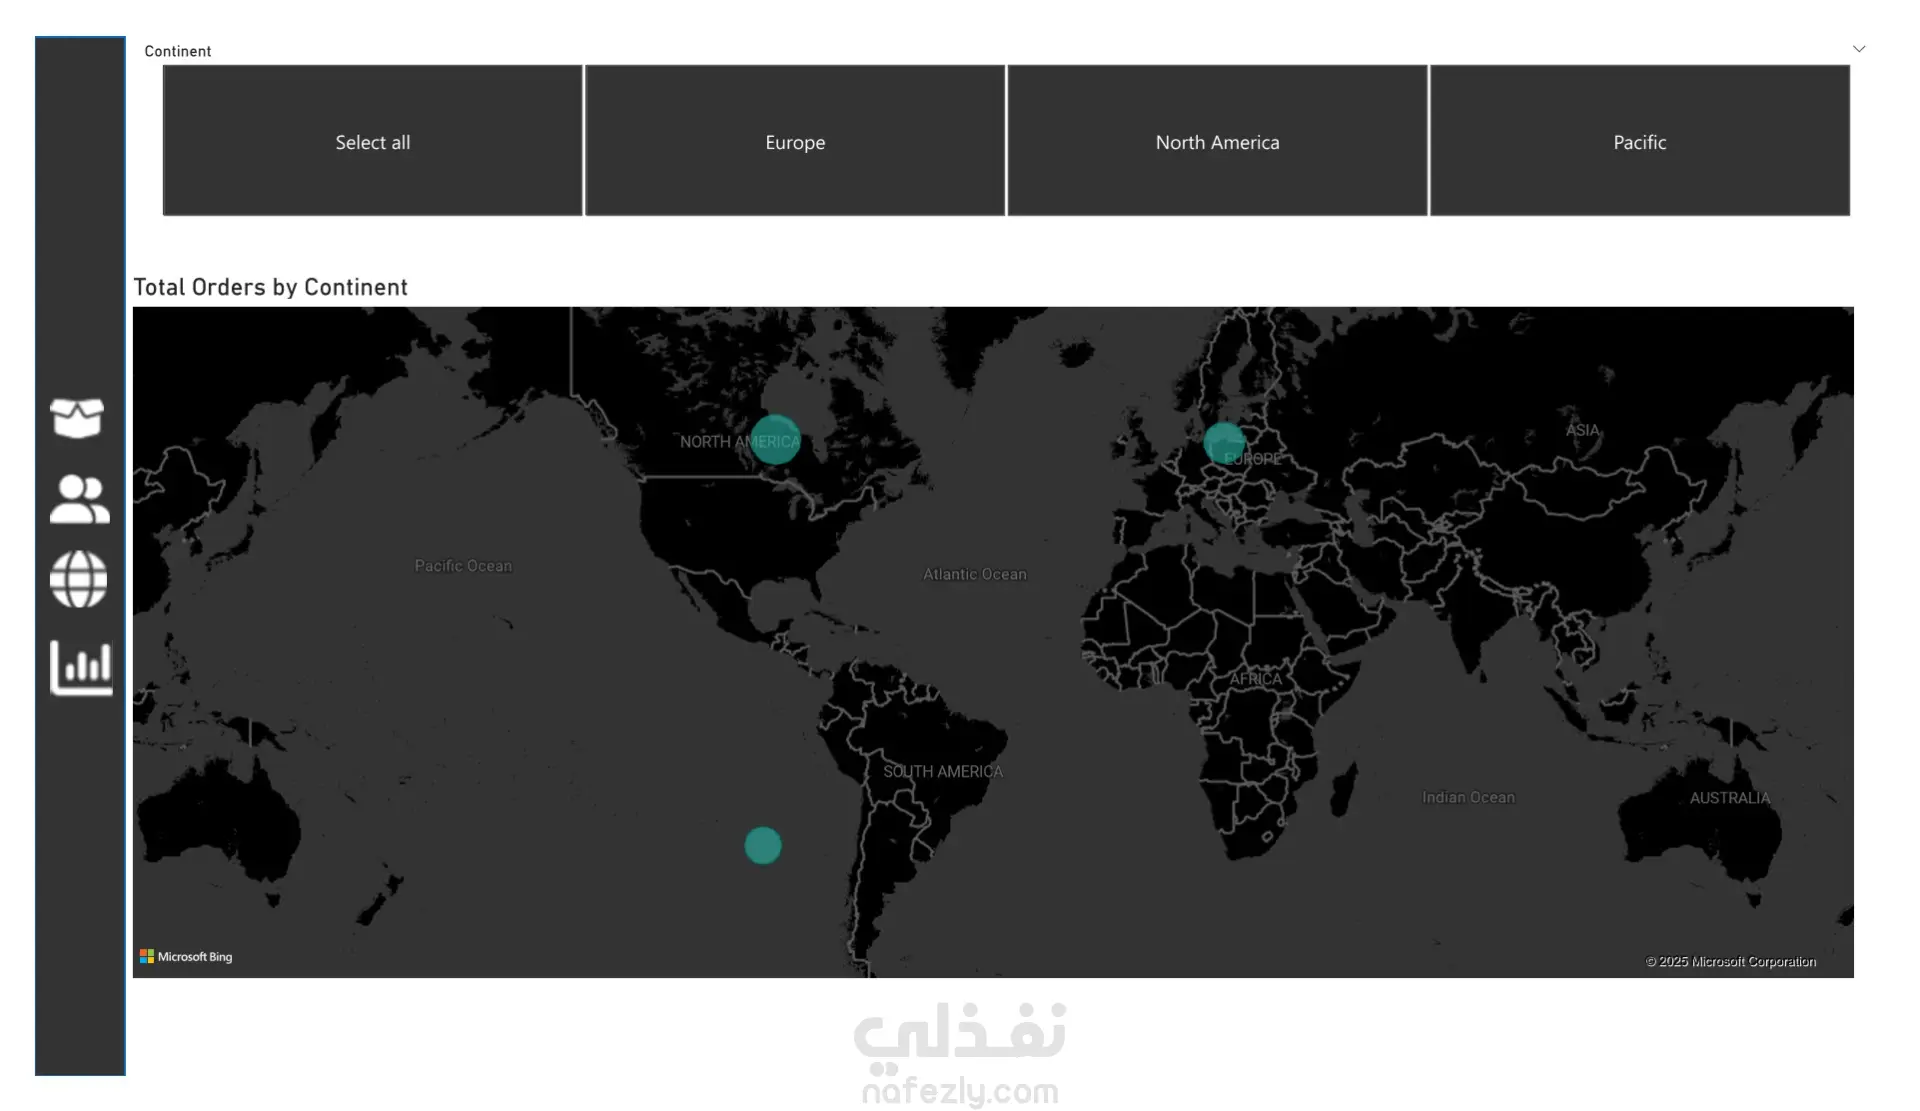
2. Regional Performance – Uses a map and slicers to explore order volume across continents and countries.
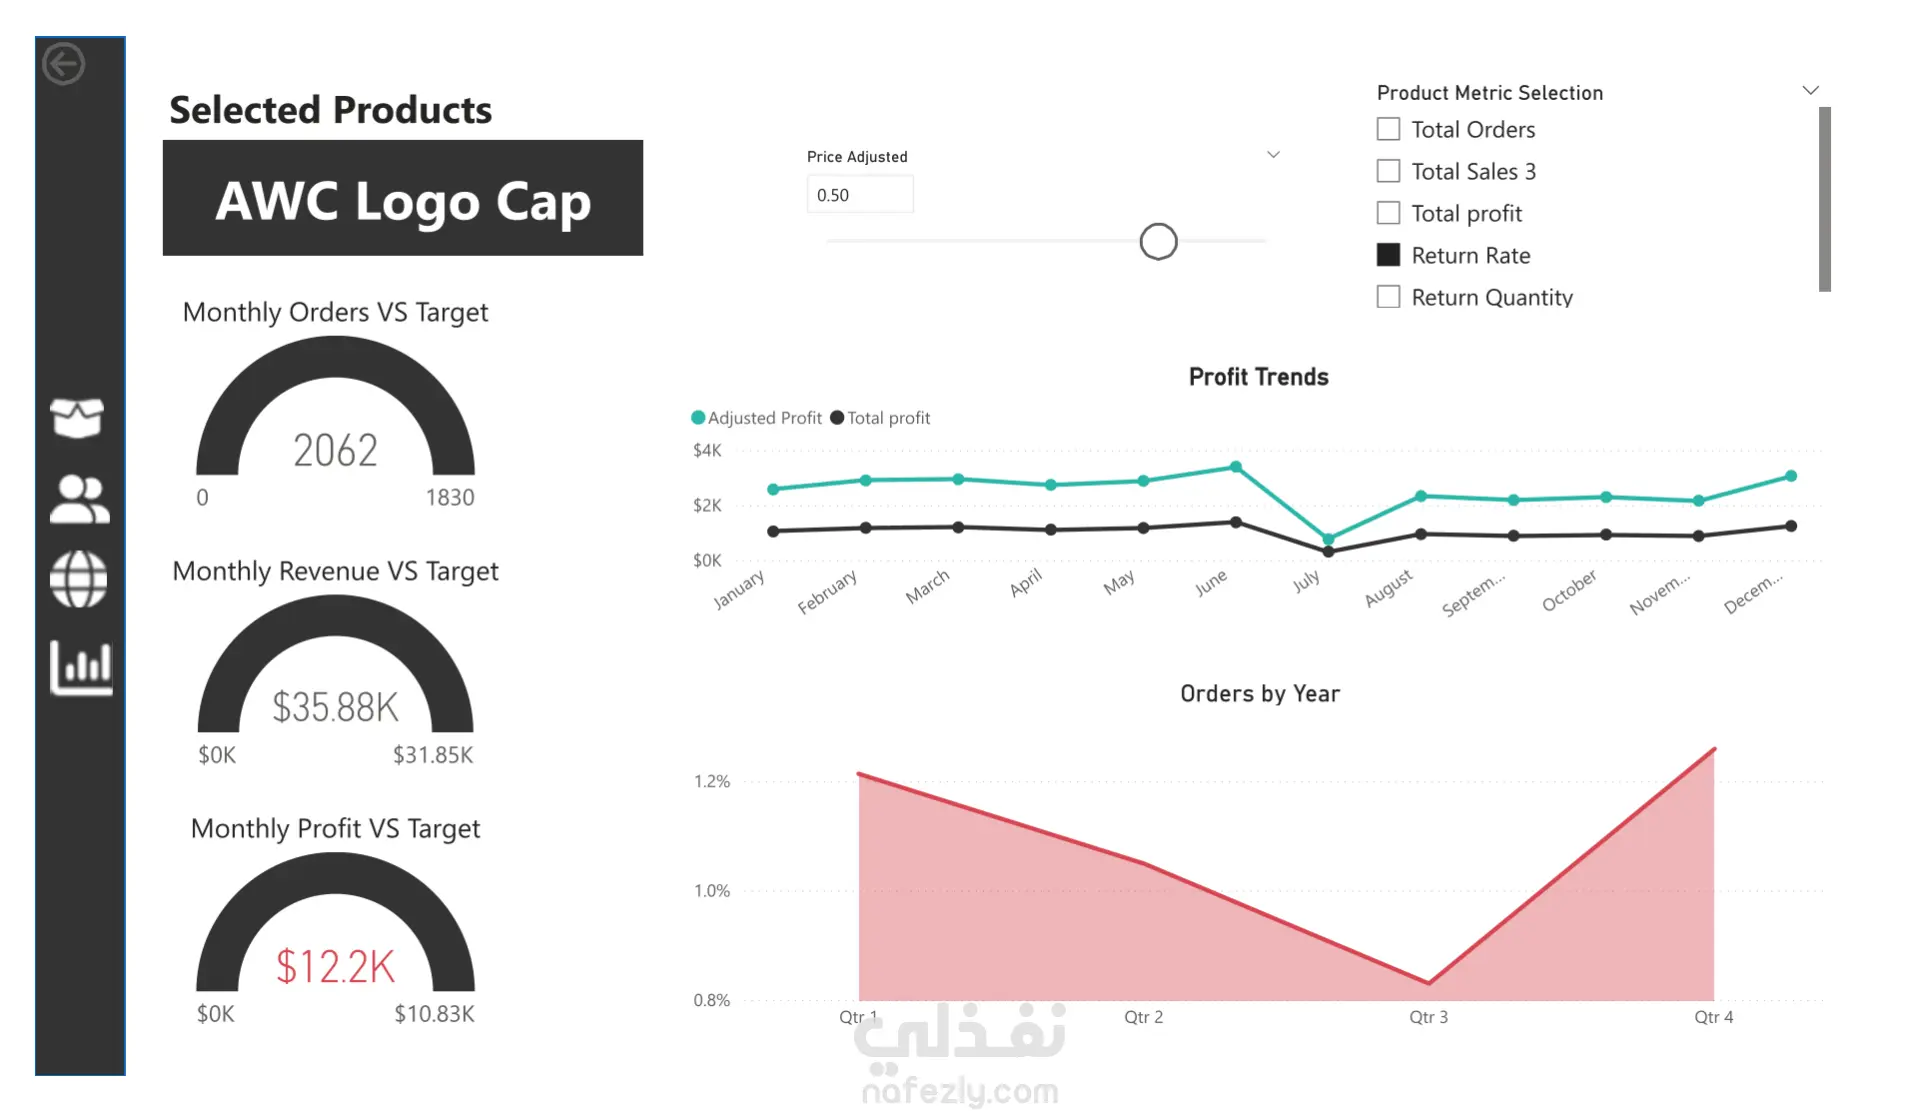
3. Product Details (Drill-through) – Highlights revenue, profit, and order targets using gauges, trend lines, field parameters, and dynamic pricing simulations.
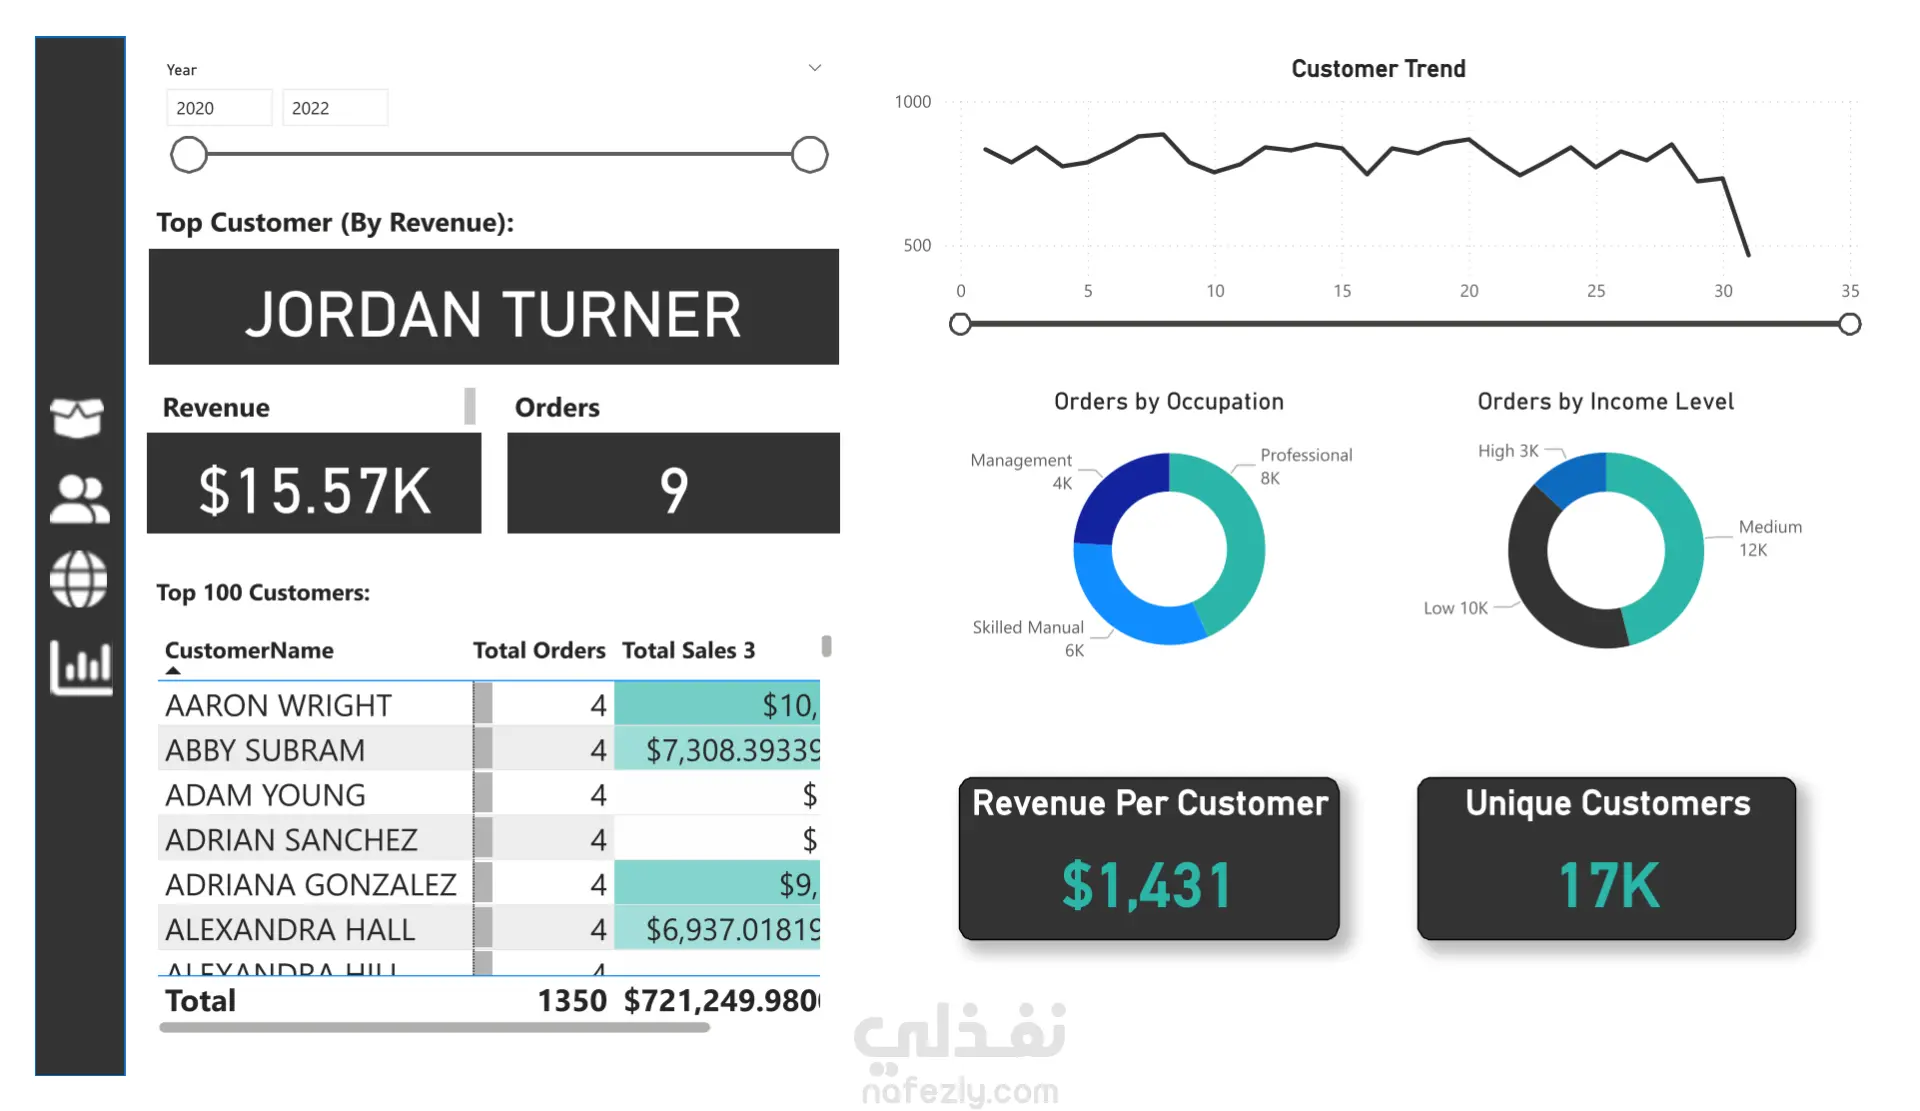
4. Customer Insights – Analyzes top 100 customers, trends by income and occupation, and showcases the top revenue-generating customer with focused KPIs.
Key project highlights:
• Built using Galaxy Schema (Sales & Returns fact tables)
• Created custom DAX measures for advanced metrics (YTD Revenue, Adjustment Price, Return Rate, Profit Targets, etc.)
• Implemented advanced Power BI features: Drill-through, Bookmarks, Field Parameters, Numeric Sliders, Custom Tooltips, and optional Row-Level Security
• Applied Power Query to clean, transform, and model data
• Delivered a dynamic, user-friendly report with strong storytelling and interactivity
This project simulates a real-world BI reporting solution tailored for decision-makers, product managers, and sales teams.