data analsis with power pi

تفاصيل العمل
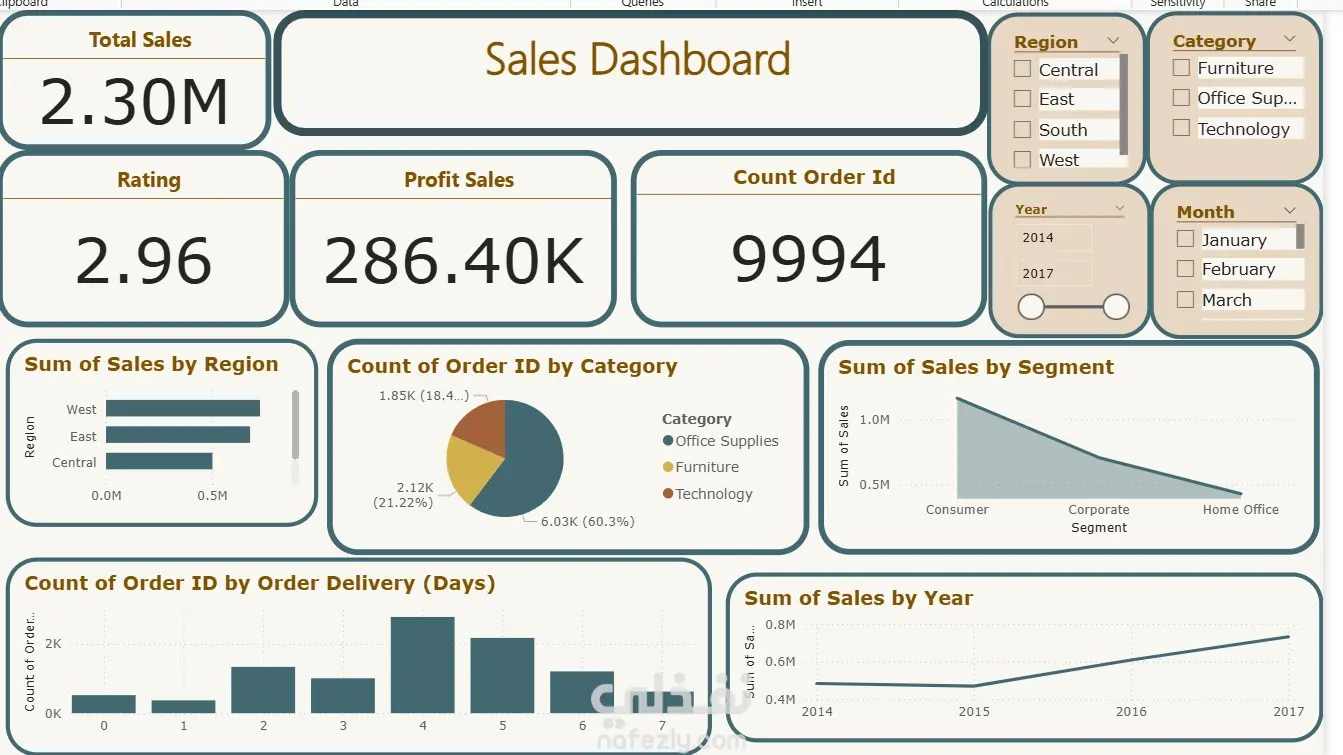
his project is an interactive Sales Dashboard built using Power BI to analyze overall sales performance across different regions, categories, segments, and years. The dashboard provides key KPIs including Total Sales (2.30M), Total Profit (286.40K), Total Orders (9994), and Average Rating (2.96). It allows dynamic filtering by Region, Category, Year, and Month using slicers to enable deeper business insights. Key visualizations include: Sales by Region Orders by Category Sales by Segment Sales Trend by Year Order Distribution by Delivery Days The dashboard helps stakeholders understand sales trends, customer segments, and regional performance to support data-driven decision-making.
مهارات العمل
بطاقة العمل

طلب عمل مماثل


