I designed and developed an interactive Sales Dashboard using Power BI to provide clear insights into business performance and support data-driven decision-making.
🔹 Key Highlights:
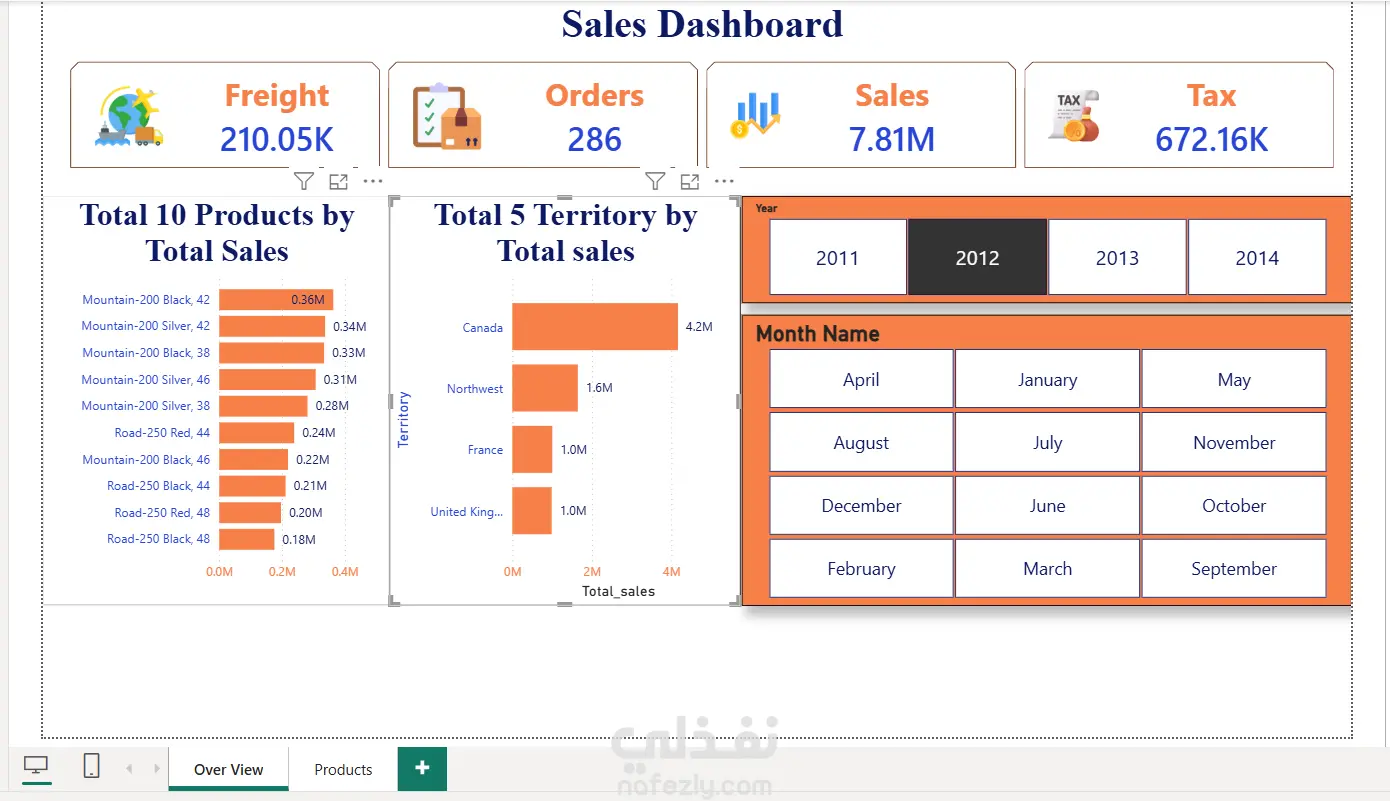
💰 Total Sales: 7.81M
📦 Total Orders: 286
🚚 Total Freight: 210.05K
🧾 Total Tax: 672.16K
📈 Dashboard Features:
✔ KPI Cards for quick performance overview
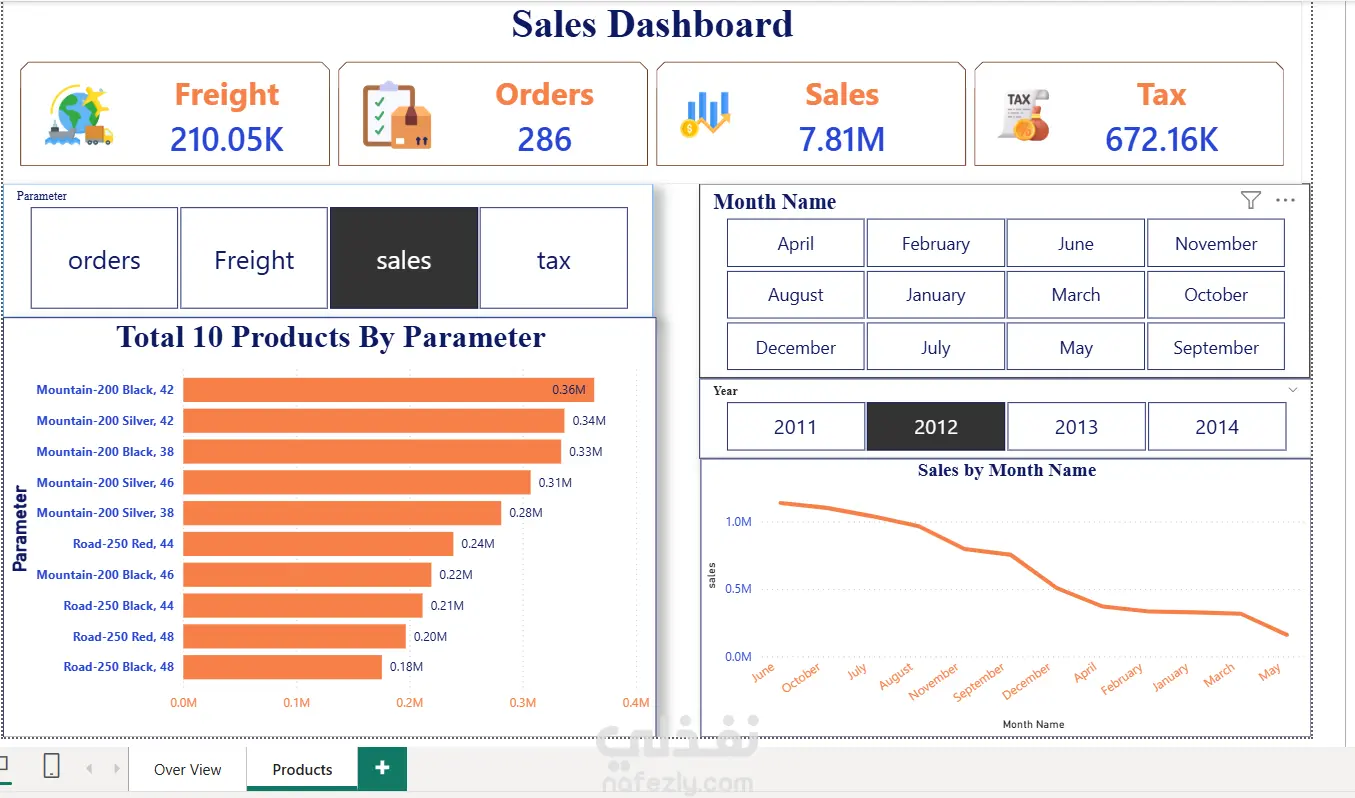
✔ Top 10 Products by Total Sales (Top product reached 0.36M)
✔ Top 5 Territories by Total Sales (Canada leading with 4.2M)
✔ Monthly Sales Trend Analysis
✔ Dynamic filtering by:
Year (2011–2014)
Month Name
Parameter selection (Sales, Orders, Freight, Tax)
🛠 Tools & Skills Used:
Power BI
Data Modeling (Fact & Dimension Tables)
DAX Measures
Data Visualization & Dashboard Design
Interactive Slicers & Filtering
🎯 Project Goal:
To transform raw sales data into a clear, interactive, and insightful dashboard that enables stakeholders to monitor performance, identify top-performing products and territories, and analyze trends over time.