Coca Cola Sales Analysis
تفاصيل العمل
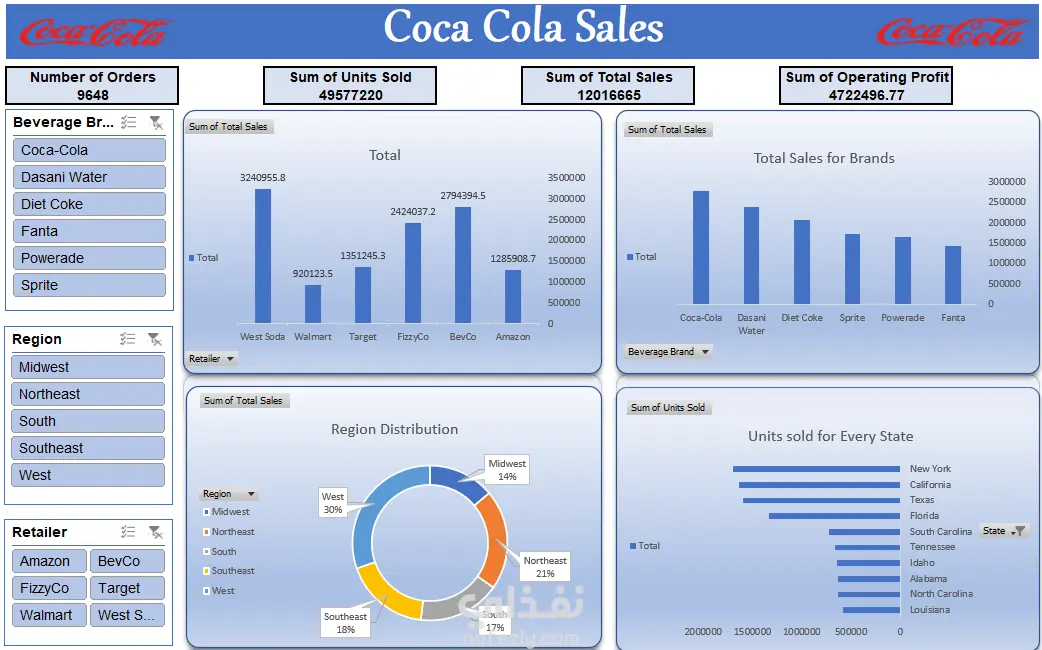
Coca-Cola sales data was downloaded and described as follows: It consisted of several columns for the distributor, distributor code, invoice date, geographic region, state, city, beverage type, unit price, number of units sold per invoice, total sales per invoice, profit earned on that invoice, and profit margin earned on that invoice. The data comprised 9650 rows. Upon reviewing the data, it was found to be accurate, clean, and free of errors or null values. Subsequently, several Pivot Tables were created, and each Pivot Table was linked to a graph. To analyze this data, a dashboard was created with cards representing the number of sales orders, the number of units sold, total sales, and finally, total profits. Four graphs were created to illustrate total sales compared to sales by distributor, product, geographic region, and finally, at the state level. Several sliders were added to further clarify the graphs.
مهارات العمل