تحليل البيانات وإنشاء Dashboards احترافية باستخدامExcel

تفاصيل العمل
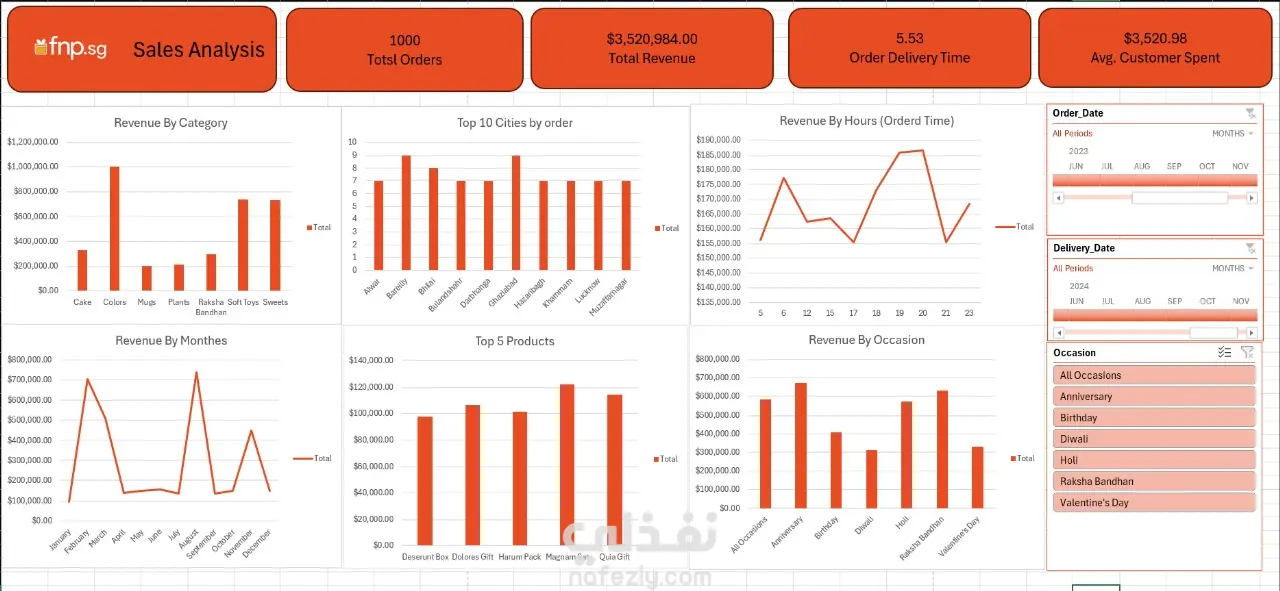
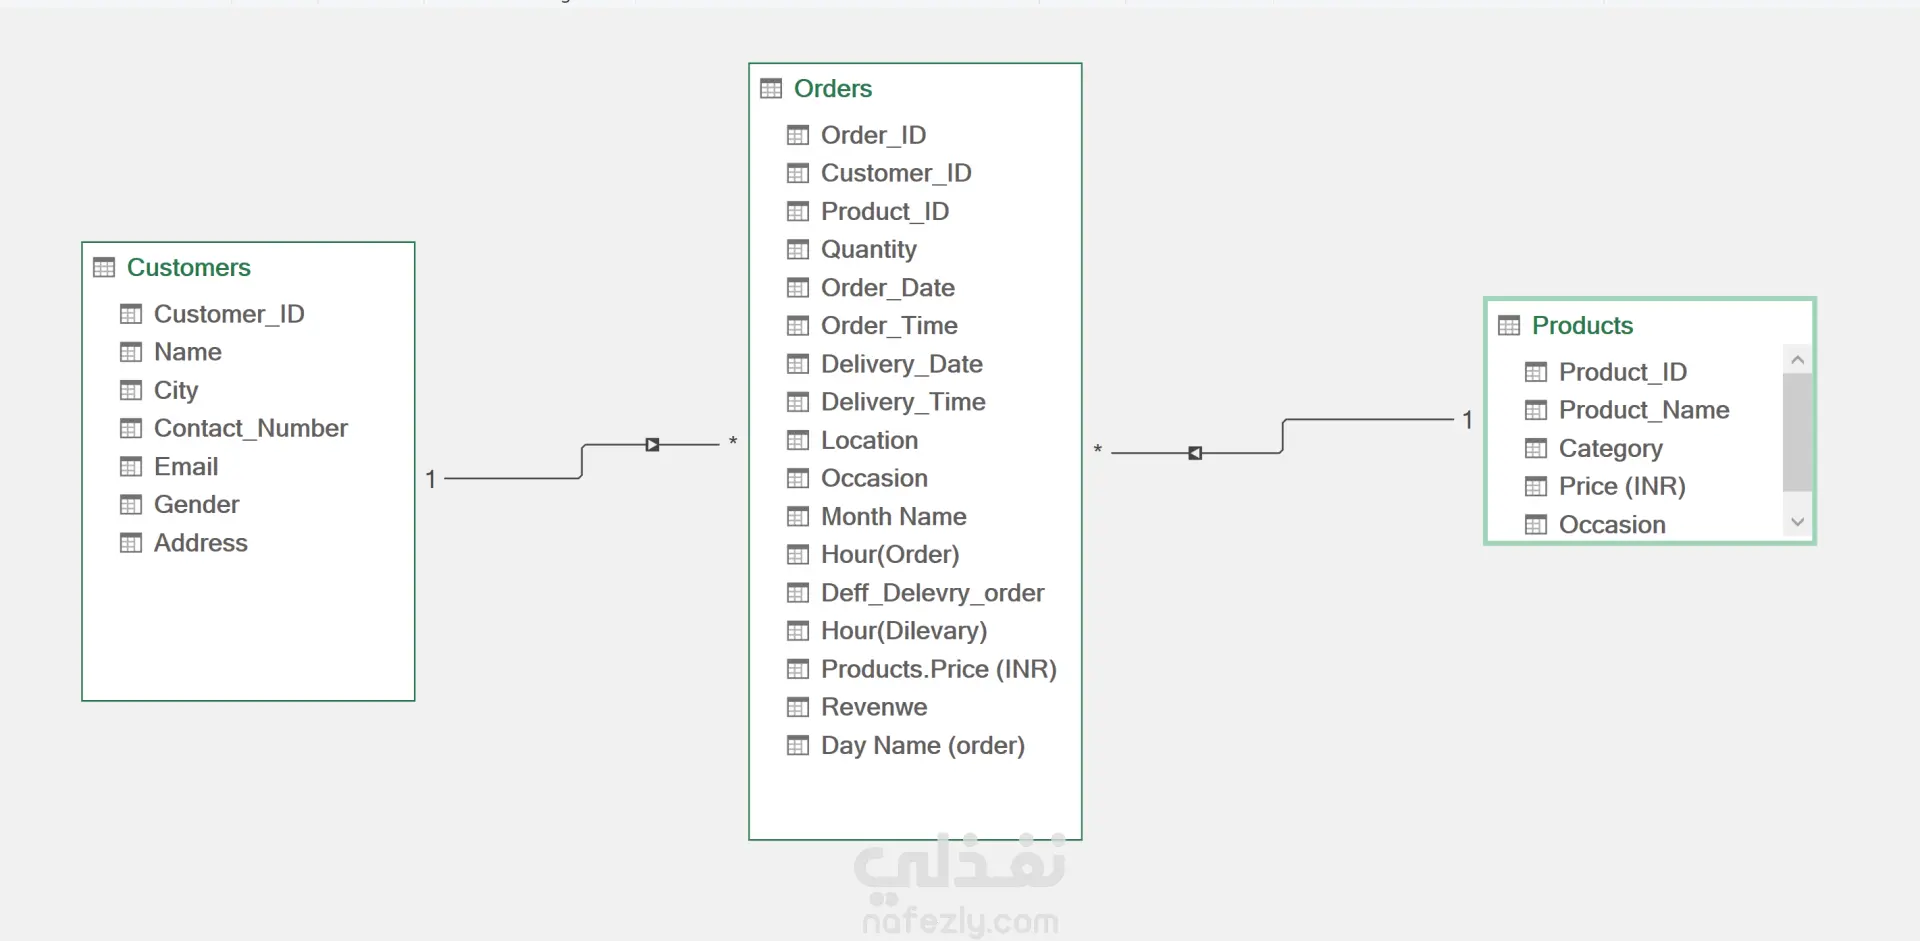
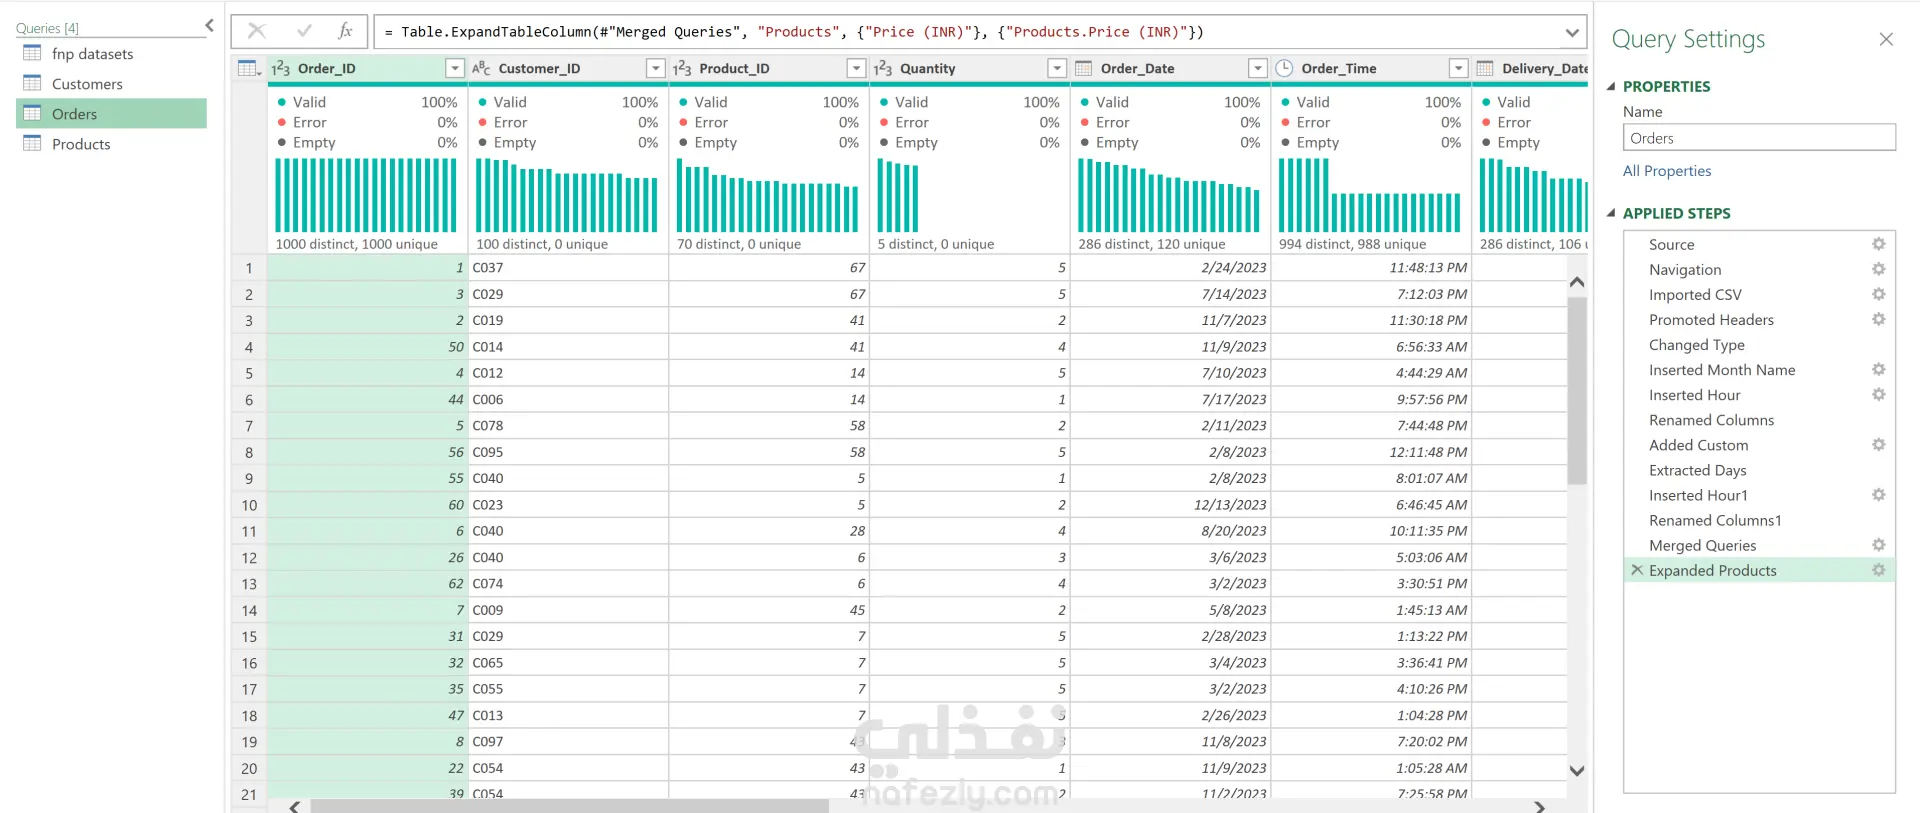
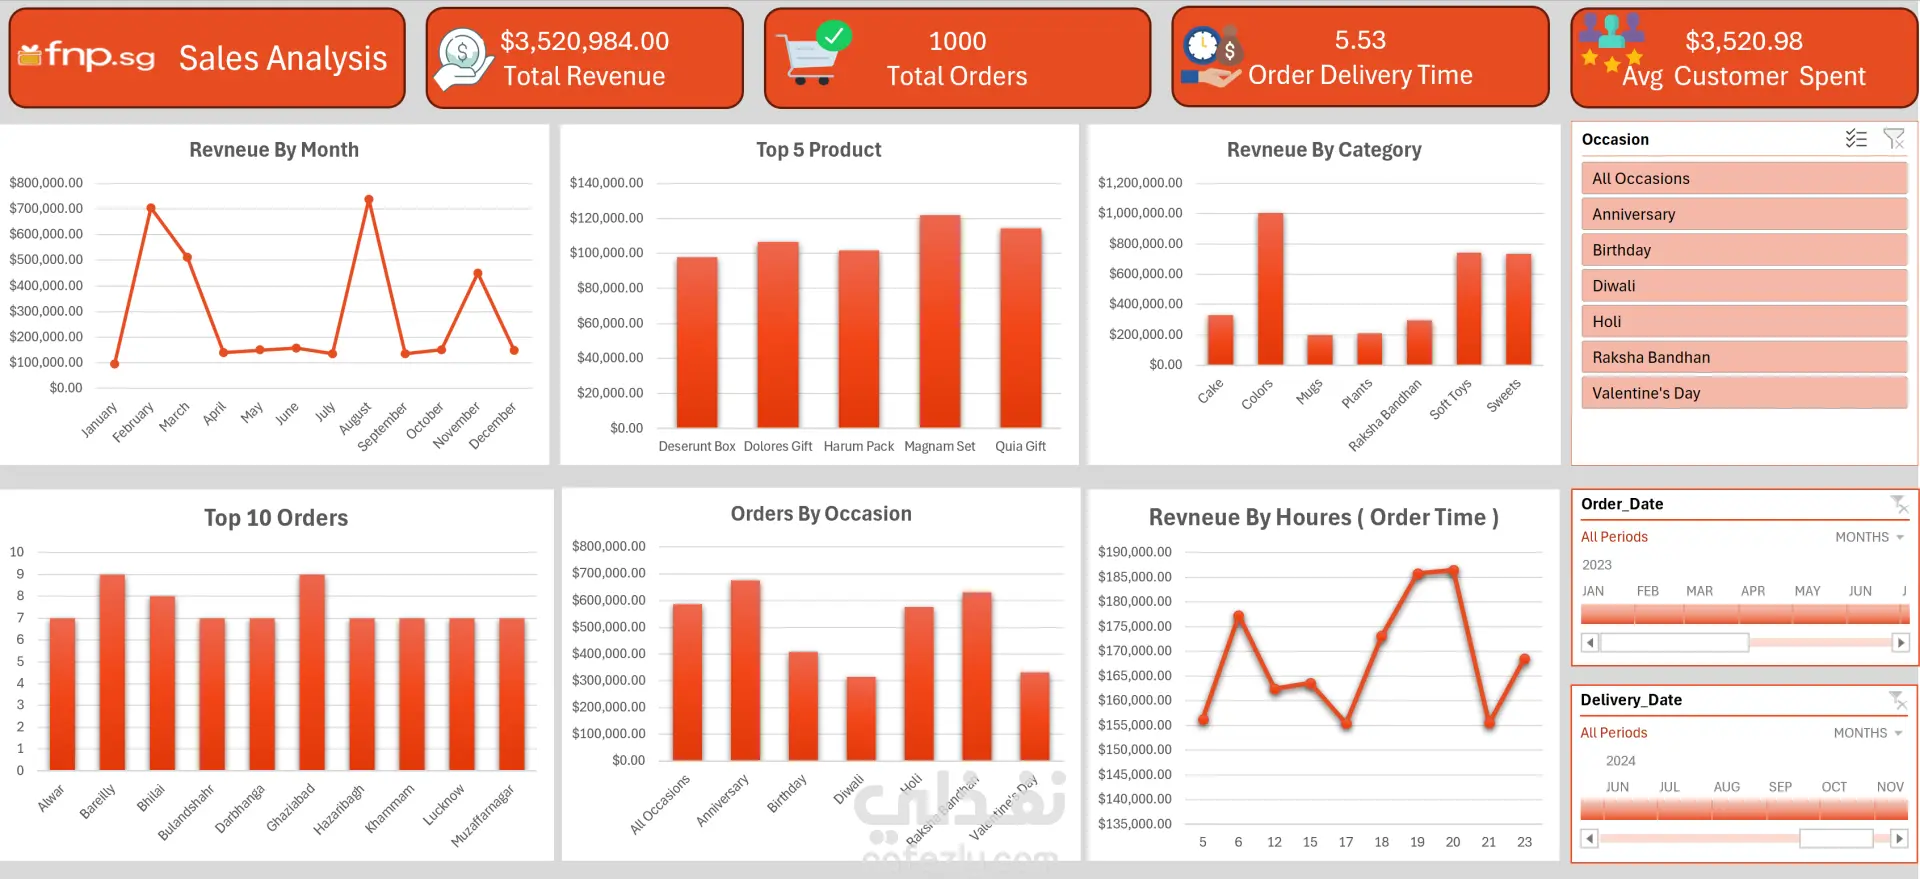
تحويل مجموعة من البيانات الخام (Raw Data) لشركة مبيعات إلى لوحة تحكم (Dashboard) احترافية وتفاعلية بالكامل باستخدام Microsoft Excel. يعتمد المشروع على أتمتة تدفق البيانات بحيث يتم تحديث التقارير والمخططات البيانية تلقائياً بمجرد إضافة بيانات جديدة. المهام التقنية التي قمت بها: هيكلة ونمذجة البيانات (Data Modeling): قمت بربط جداول العملاء، المنتجات، والطلبات (Relationship Management) داخل الإكسيل لبناء قاعدة بيانات قوية ومترابطة. تنقية البيانات وتجهيزها (Power Query): استخدمت محرك Power Query لتنظيف البيانات، دمج الجداول، ومعالجة التواريخ والأوقات (ETL Process) لضمان دقة النتائج. التحليل المتقدم (Pivot Tables): بناء جداول محورية لتحليل الإيرادات حسب الشهور، الساعات، وتصنيفات المنتجات المختلفة. تصميم واجهة تفاعلية (Interactive Dashboard): تصميم لوحة مؤشرات أداء (KPIs) جذابة وسهلة القراءة، مع إضافة (Slicers) تتيح للمستخدم الفلترة حسب "المناسبة" أو "التاريخ" بضغطة زر.
مهارات العمل
بطاقة العمل

طلب عمل مماثل


