-Sales Performance & Revenue Analysis | Microsoft Excel
تفاصيل العمل
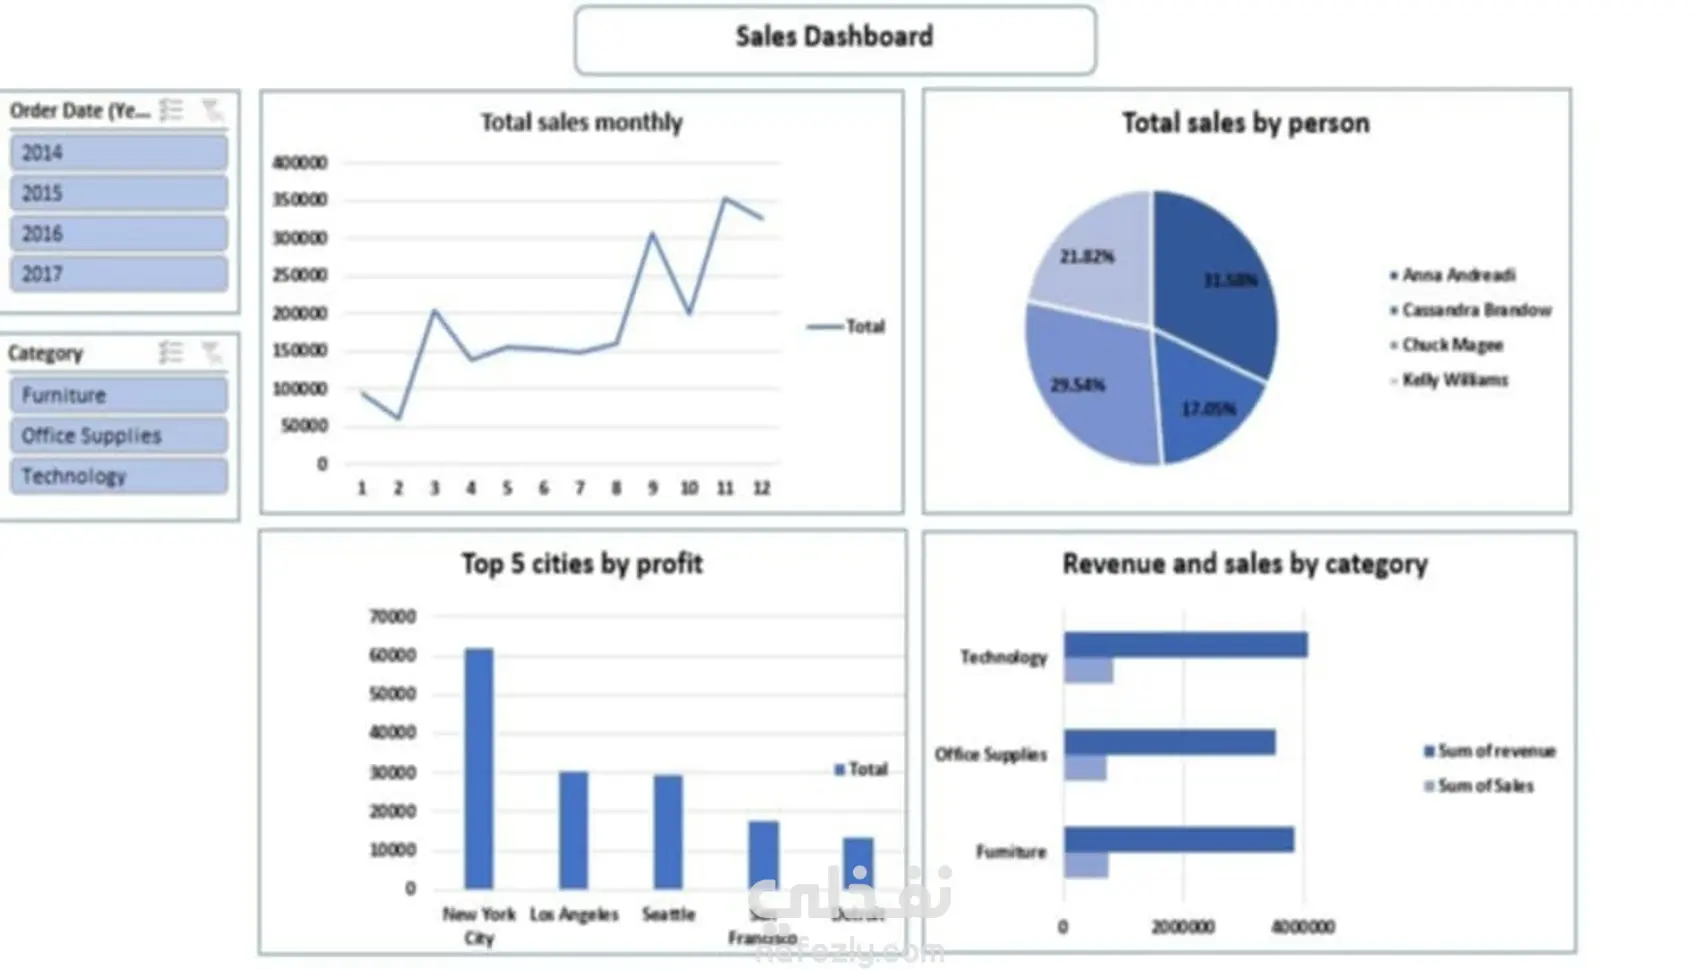
Developed a comprehensive Sales Dashboard to track and analyze monthly revenue trends and salesperson performance. Visualized regional profitability, identifying New York City as the top-performing city with a significant profit margin exceeding 60,000. Analyzed sales distribution by team members using Pie Charts Created category-based revenue comparisons (Technology, Furniture, Office Supplies) using Clustered Bar Charts to monitor product performance against total sales. Implemented interactive Slicers (Order Date & Category) to allow users to filter data dynamically by year (2014-2017) and product type.
مهارات العمل


