Real data analysis
تفاصيل العمل
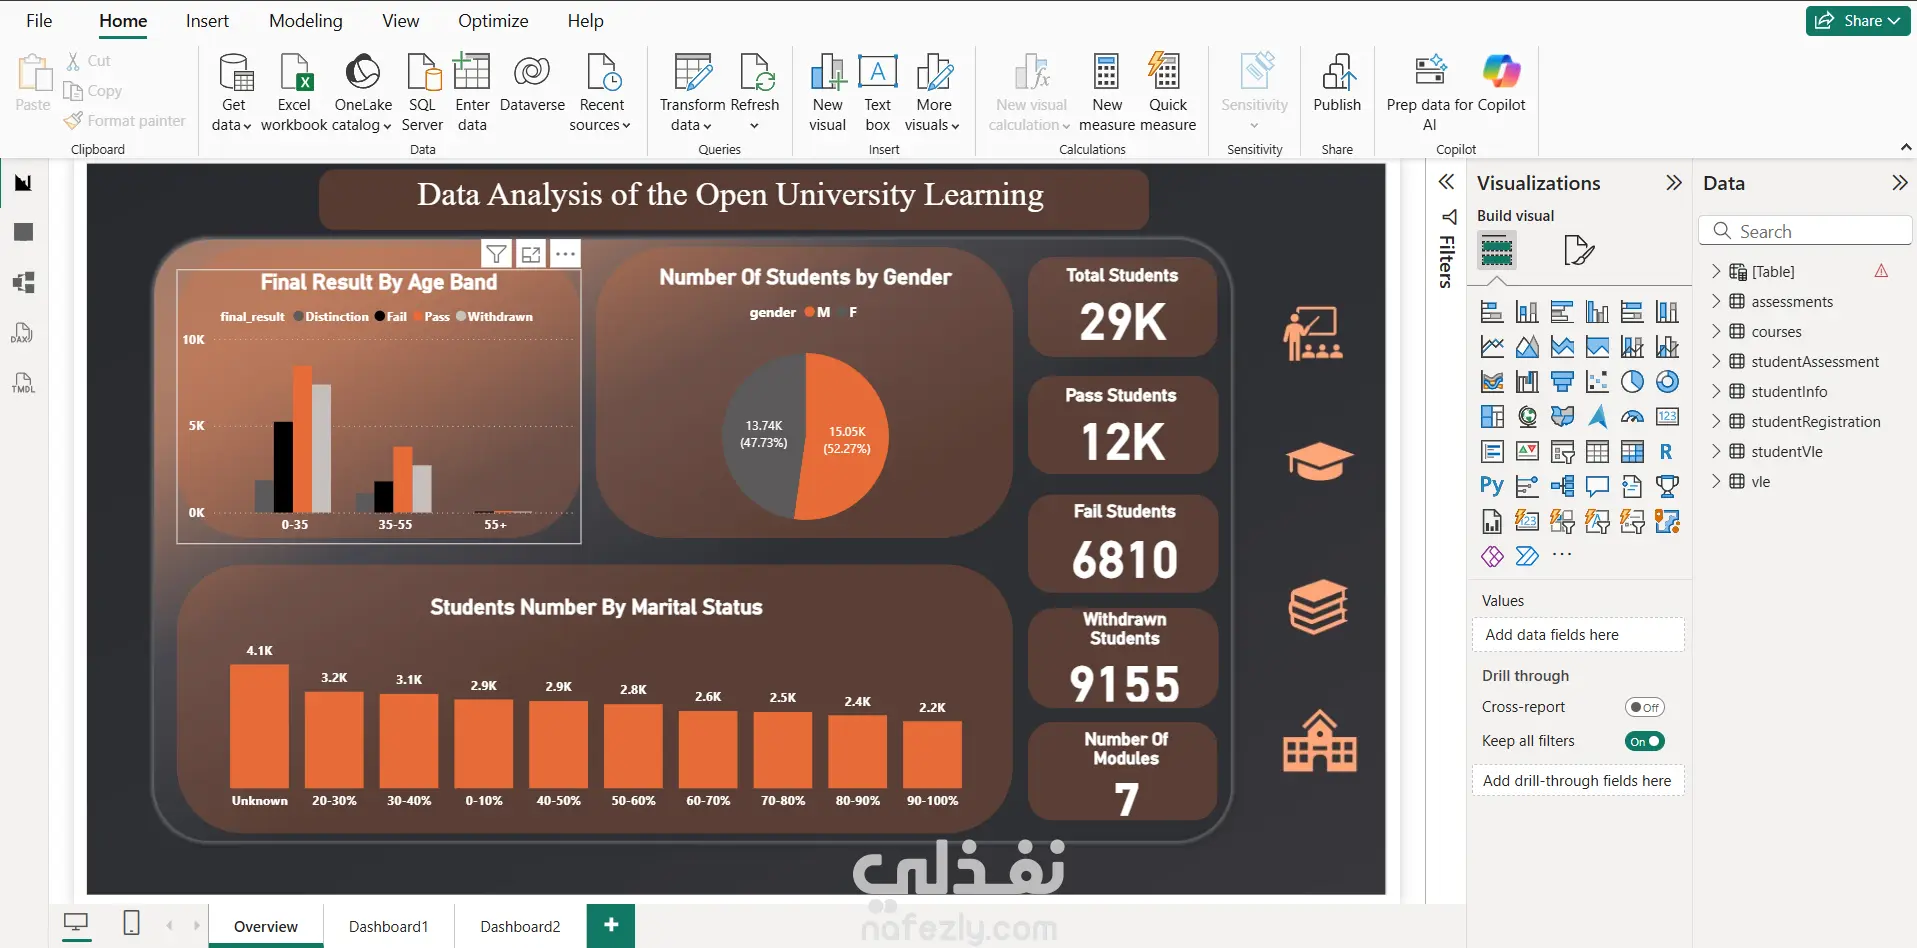
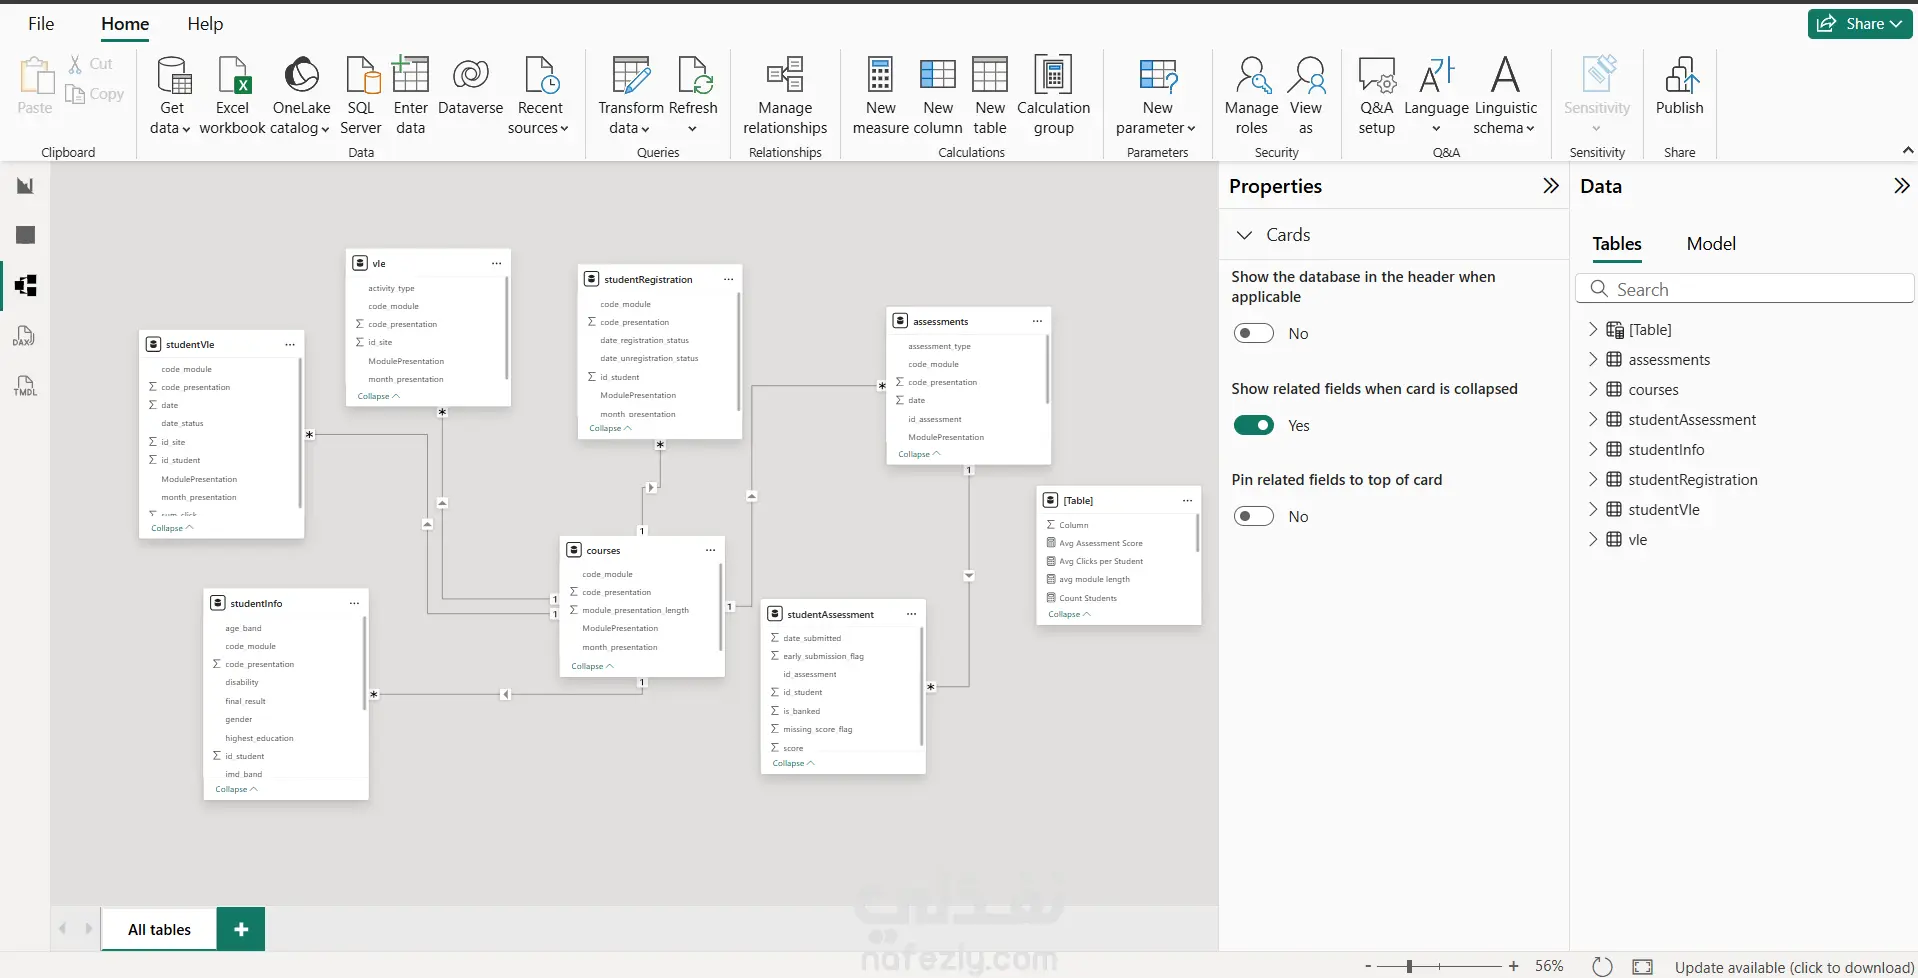
This project is a comprehensive Power BI dashboard developed to analyze and visualize Open University Learning data. The goal of the dashboard is to transform raw educational data into clear, actionable insights that support data-driven decision-making. 🔹 Project Objectives Analyze student performance and outcomes Understand student demographics and behavior Present key educational metrics in a clear and interactive format 🔹 Key Features Final Results Analysis by Age Band (Pass, Fail, Distinction, Withdrawn) Students Distribution by Gender Key Performance Indicators (KPIs): Total Students Passed Students Failed Students Withdrawn Students Students Distribution by Marital Status Overview of Number of Modules Interactive visuals for easy exploration and comparison 🔹 Tools & Technologies Used Power BI Data Modeling & Relationships DAX Measures Data Cleaning & Transformation Data Visualization Best Practices 🔹 Outcome The dashboard provides a clear overview of student performance and demographics, helping educational institutions and decision-makers quickly identify trends, strengths, and areas for improvement. The visual design focuses on simplicity, readability, and effective storytelling with data.
مهارات العمل
بطاقة العمل

طلب عمل مماثل


