Tableau Sales Dashboard

تفاصيل العمل
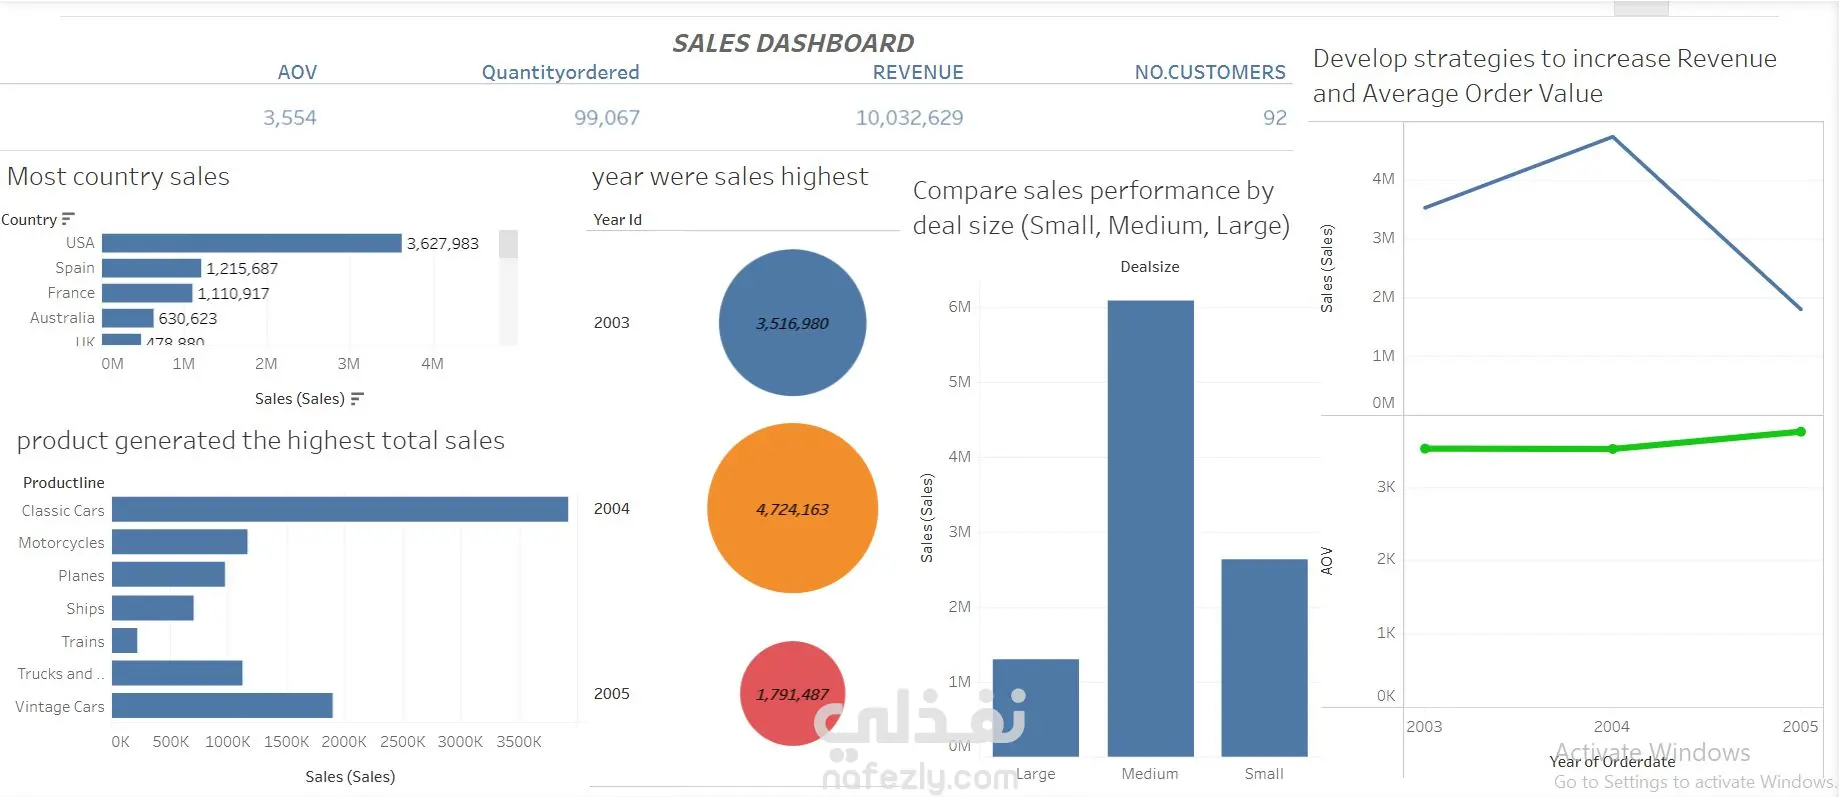
I cleaned and prepared the sales data (Products, Countries, Years, Deal Size, Customers) for Tableau, then built key KPIs such as Revenue, Customer Count, AOV, and Quantity Ordered. The dashboard highlighted top-performing countries (USA, Spain, France), best-selling product lines (Classic Cars), deal size performance, and revenue trends from 2003–2005. Key insights showed that 2004 had the highest revenue, the USA led profit, Medium deals drove most income, and despite a revenue drop in 2005, AOV increased, indicating higher-value purchases. This helped define clearer sales strategies.
مهارات العمل


