This project is an Amazon Sales Dashboard built using Power BI for data visualization. The data was cleaned and preprocessed using Excel Power Query, and the final dashboard provides insights into sales, profit, and customer trends.
Features
Data Cleaning & Preprocessing: Handled using Excel Power Query.
Interactive Dashboard: Developed in Power BI with multiple pages including:
Home Page: Navigation to different sections.
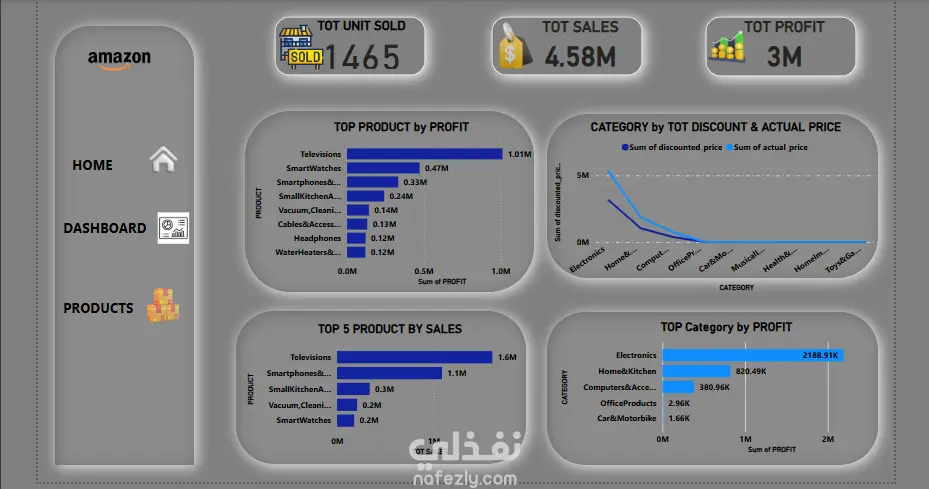
Dashboard Page: Key metrics like total sales, total profit, and unit sales.
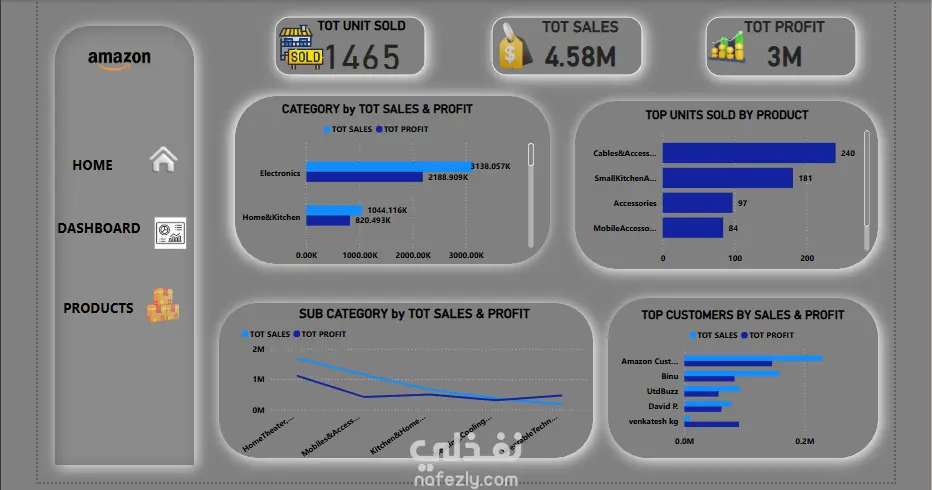
Products Page: Sales breakdown by category, sub-category, and product.
Visualizations:
Sales and profit by category & sub-category.
Top customers by sales and profit.
Units sold per product.
Discounted price vs. actual price by category.
Profit contribution by product and category.
Tools Used
Power BI: For data visualization.
Excel Power Query: For data cleaning and preprocessin