Netflix Data Analysis Dashboard (Power BI)


تفاصيل العمل
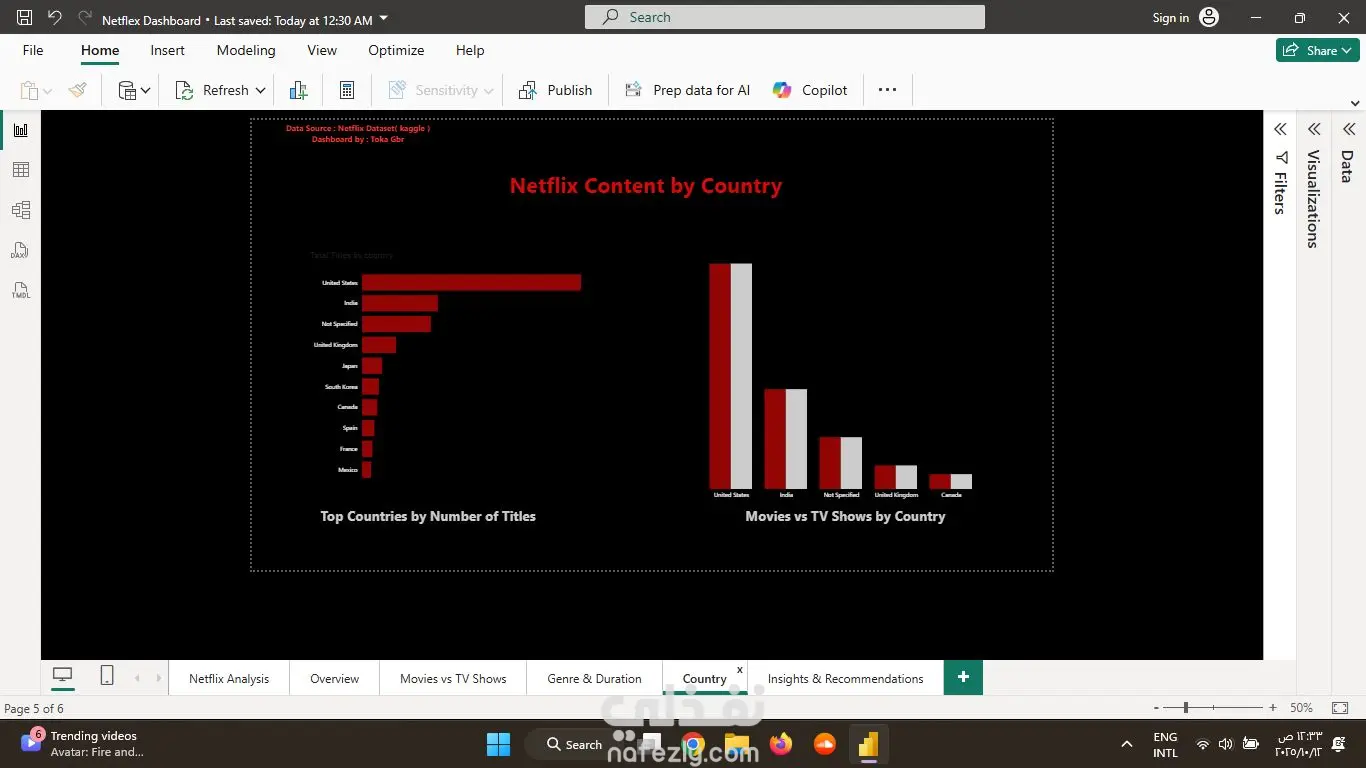
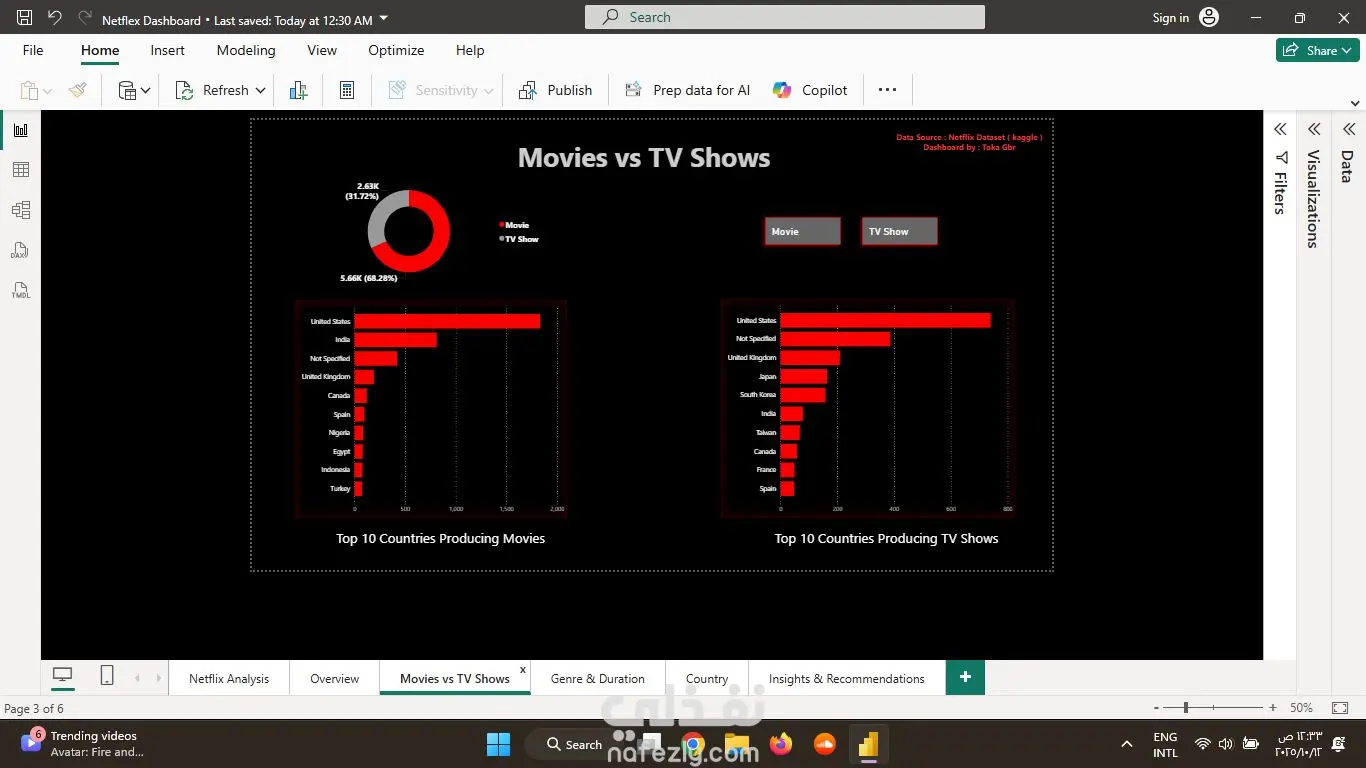
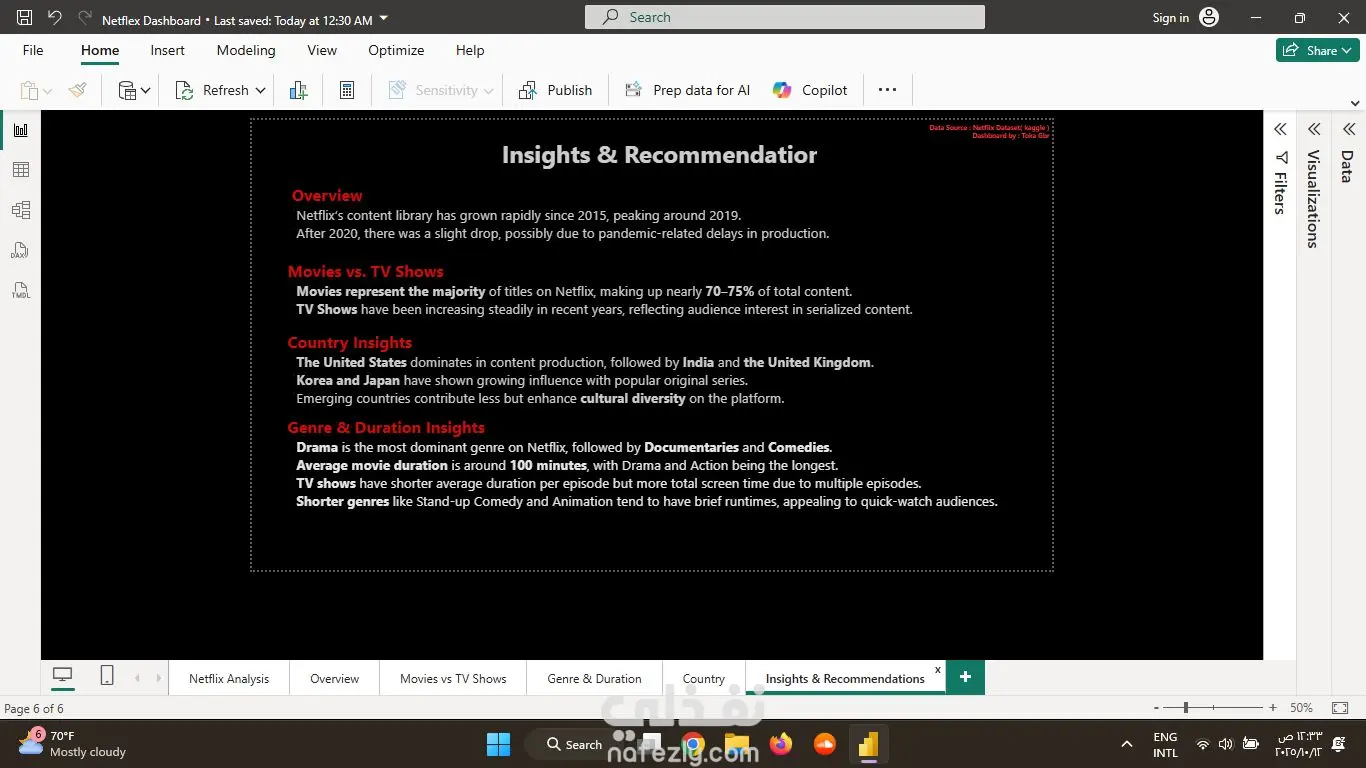
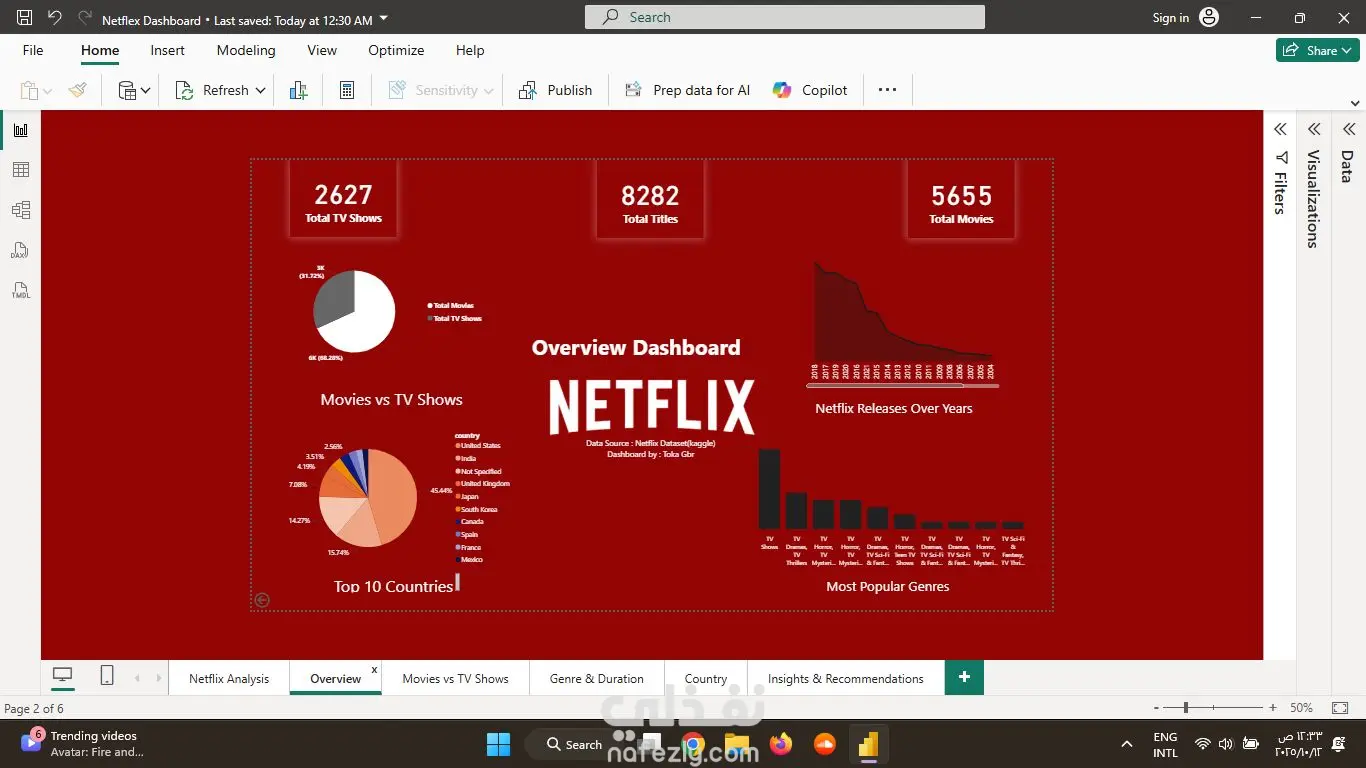
Project Overview This project explores Netflix data to analyze: Distribution of Movies vs TV Shows Content trends over the years Top countries producing content Popular genres Ratings and duration insights The goal is to demonstrate strong data analysis, visualization, and storytelling skills using Power BI. Data Cleaning & Transformation Performed in Power Query: Removed duplicates and null values Split multiple countries and genres Extracted numeric duration Standardized column names and formats Key Insights A large portion of content was released between 2017–2019. Movies dominate Netflix’s library. United States and India are leading in content production. Dramas and Comedies are the most popular genres. Tools Used Microsoft Power BI – Visualization & Dashboard Design Power Query – Data Cleaning & Transformation Excel / CSV Dataset – Data Source Disclaimer This is a demo project created for learning and portfolio purposes. It’s not affiliated with Netflix, and the dataset was obtained from a public source.
مهارات العمل