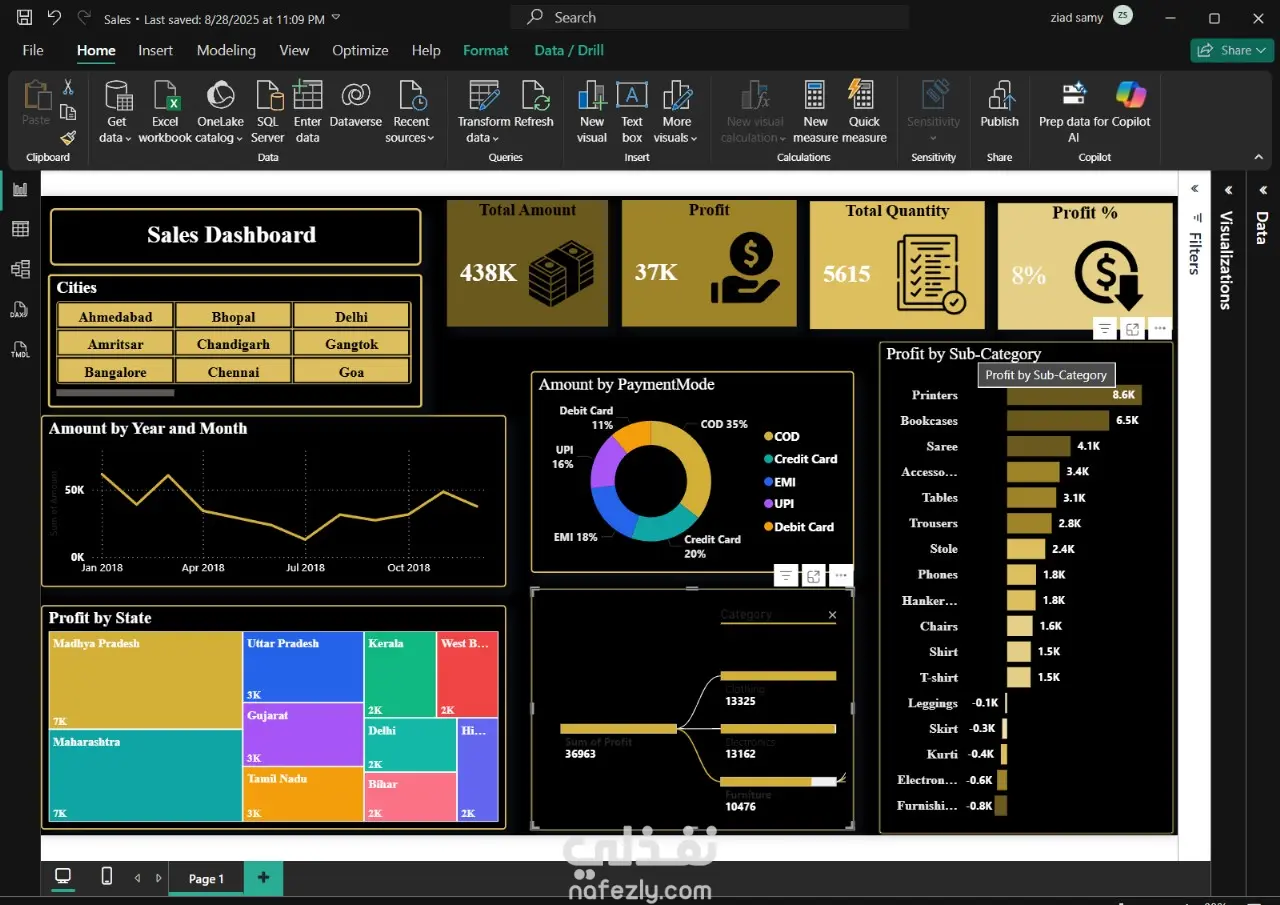
This project involved designing and developing a professional Power BI Sales Dashboard to analyze company performance, visualize KPIs, and track profitability across regions, product categories, and payment modes.
Dynamic Filters (Slicers) for City and Category
Key Performance Indicators (KPIs) section displaying:
Total Sales Amount
Profit
Total Quantity Sold
Profit Margin %
Time Series Analysis: Monthly sales trend (Amount by Year and Month)
Payment Analysis: Pie chart showing sales by payment method
Regional Analysis: Profit distribution by state (Treemap)