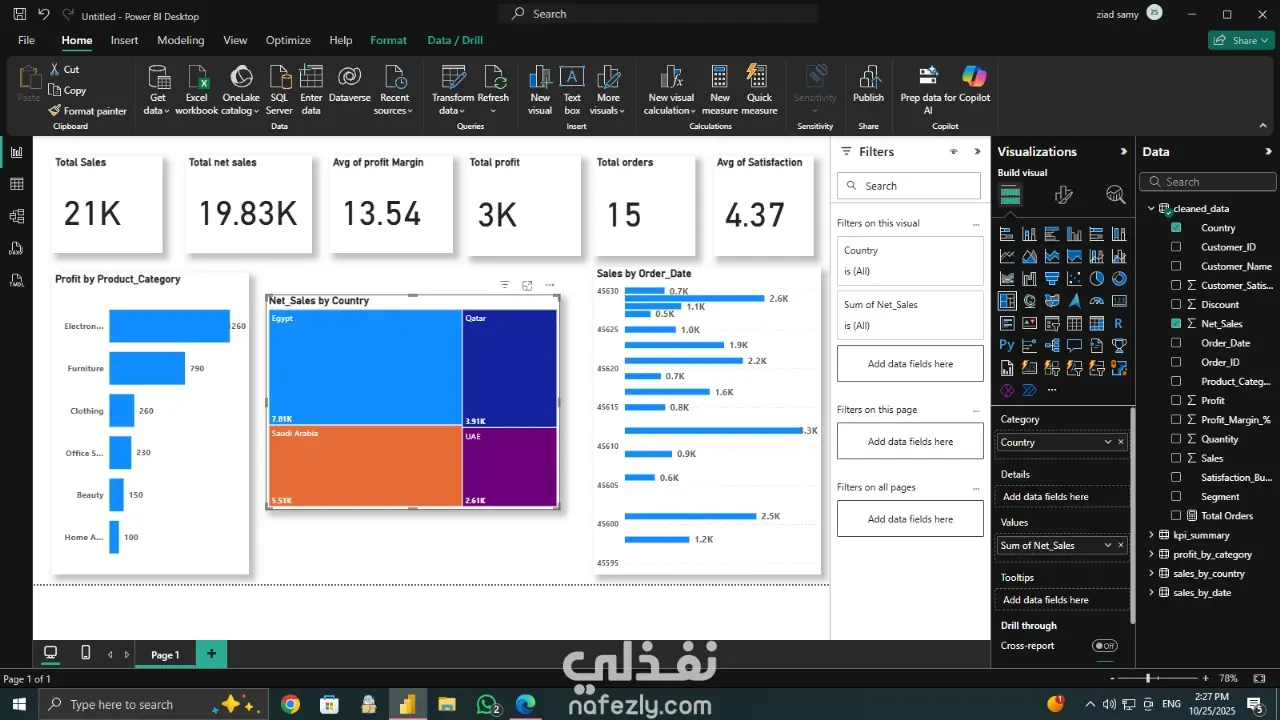
Sales & Profit Overview Dashboard
This Power BI dashboard provides a snapshot of key sales and profitability metrics. It prominently displays:
KPIs: Total Sales (21K), Total Net Sales (19.83K), Avg Profit Margin (13.54), Total Profit (3K), Total Orders (15), and Avg Satisfaction (4.37).
Top Profit Categories: "Electronics" (1260) leads in profit, followed by "Furniture."
Net Sales by Country: "Egypt" (7.81K) and "Saudi Arabia" (5.51K) are the largest contributors to net sales.
Daily Sales Trends: A bar chart visualizes sales performance across different order dates.