Titanic Machine Learning from Disaster project
I am thrilled to share a recent project that I've been working on: Titanic Dataset, work on removing the missing value and replacing it with the mode value and removing the existing outliers.
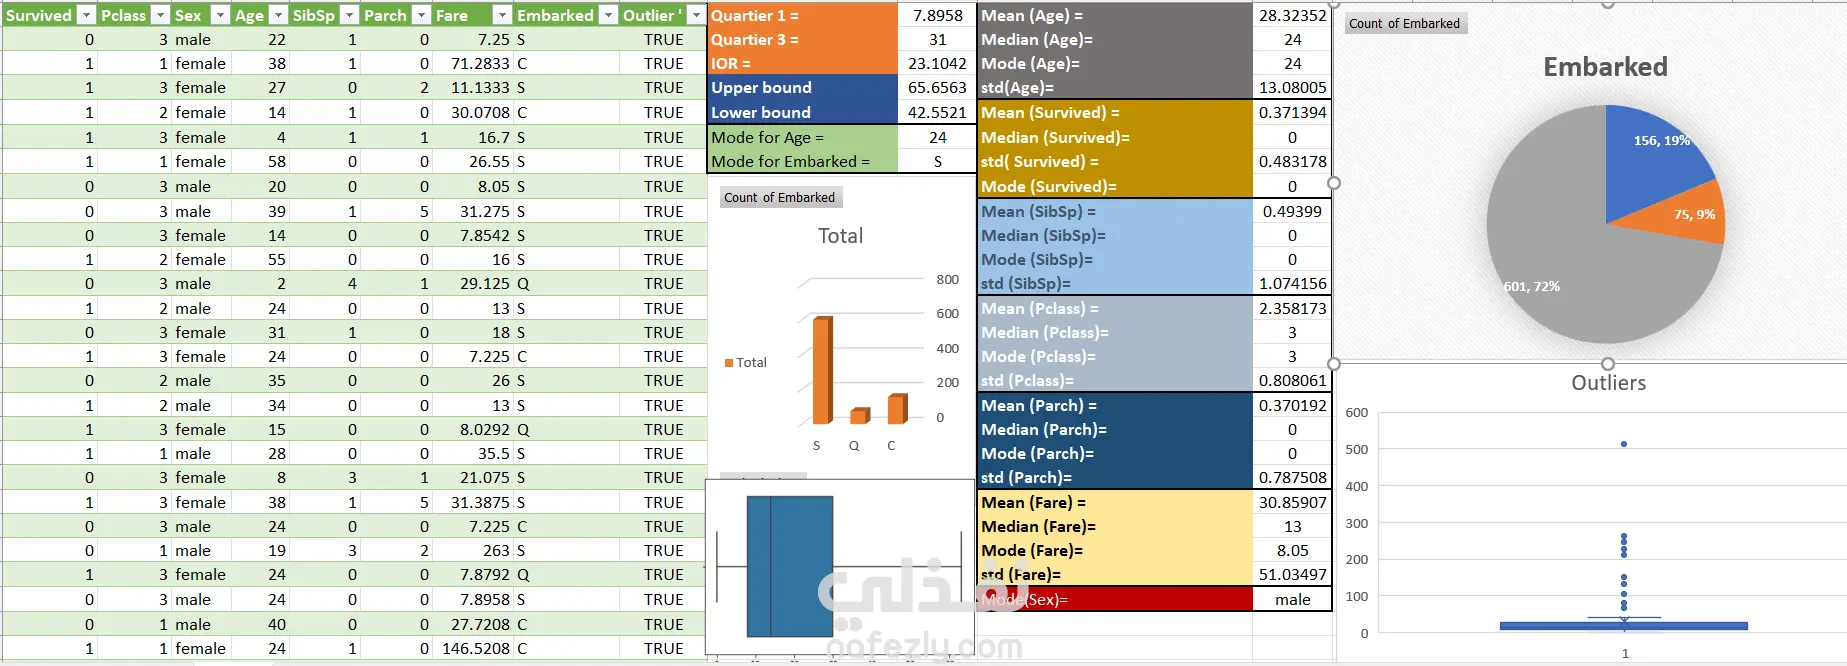
🔑 Key Steps:
Data Analysis and Preprocessing: First, I did this project first on Excel, and secondly on Jupyter, and its visualization work on Excel. I first knew the missing value and then replaced it with the relevant value, so I calculated the mode and replaced it with the mode, and then removed the unimportant data, such as the names of people and Ticket names, ID and others.
🔑 Know the locations of the outliers and removed the outliers and defined it by using capping and flooring because Skewness the skewness value should be within the range of -1 to 1 for a normal distribution, any major changes from this value may indicate the presence of outliers so I removed all the values that were above the 1 and below the -1 .
🔑 Exploratory Data Analysis (EDA): Through captivating visualizations, we gained valuable insights into the correlations between different features and the target variable. And after the data became suitable for work, I extracted the simple insights from it, and that project was only intended to remove the missing data and outliers, but I did some small visualization.
🔑 Github link: https://lnkd.in/dGiVNCcQ.