Data Analysis & Visualization for Covid-19 Statistics

تفاصيل العمل
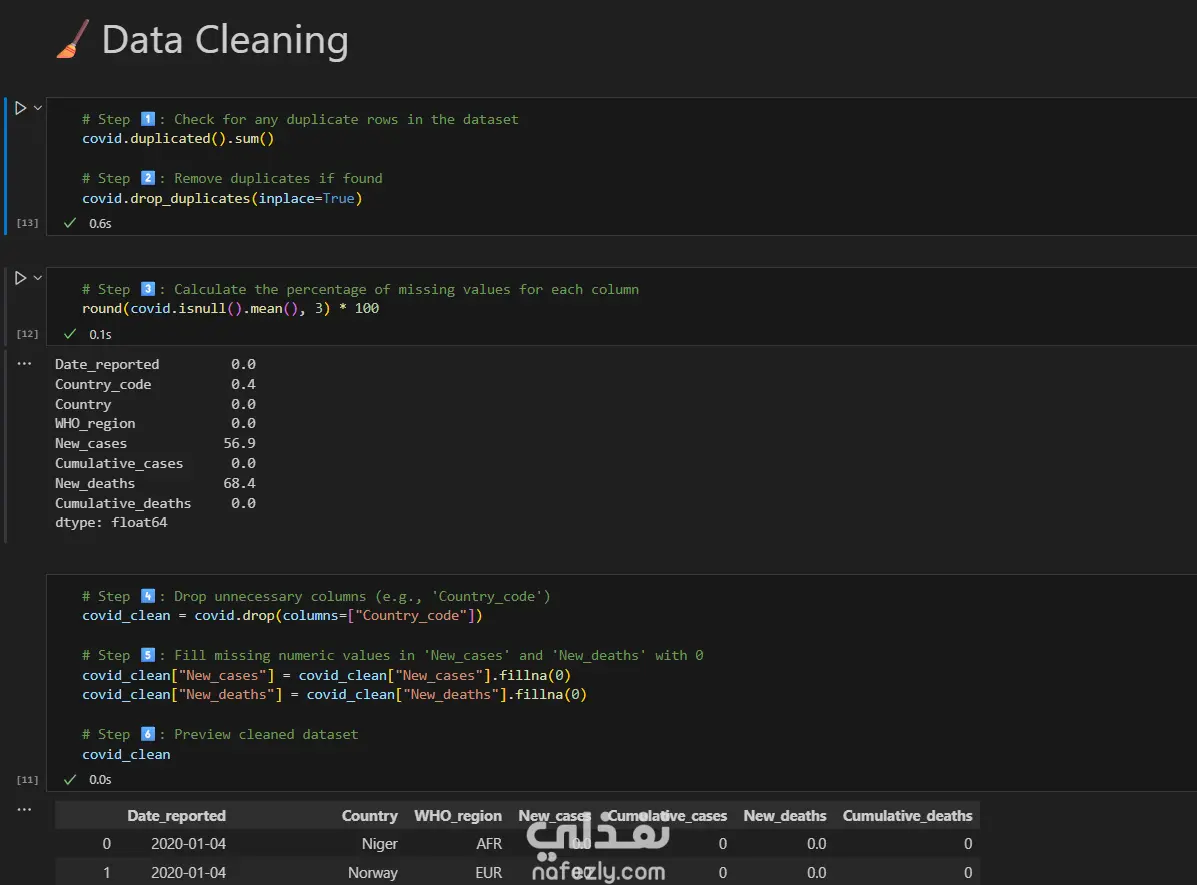
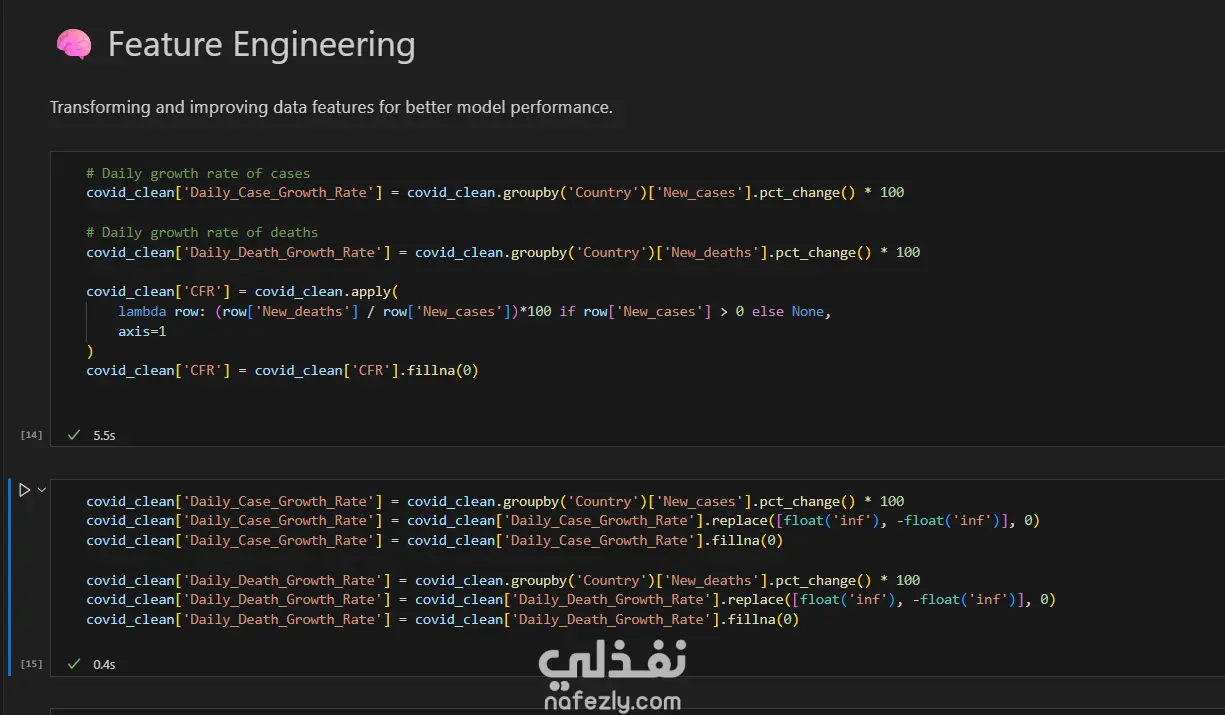
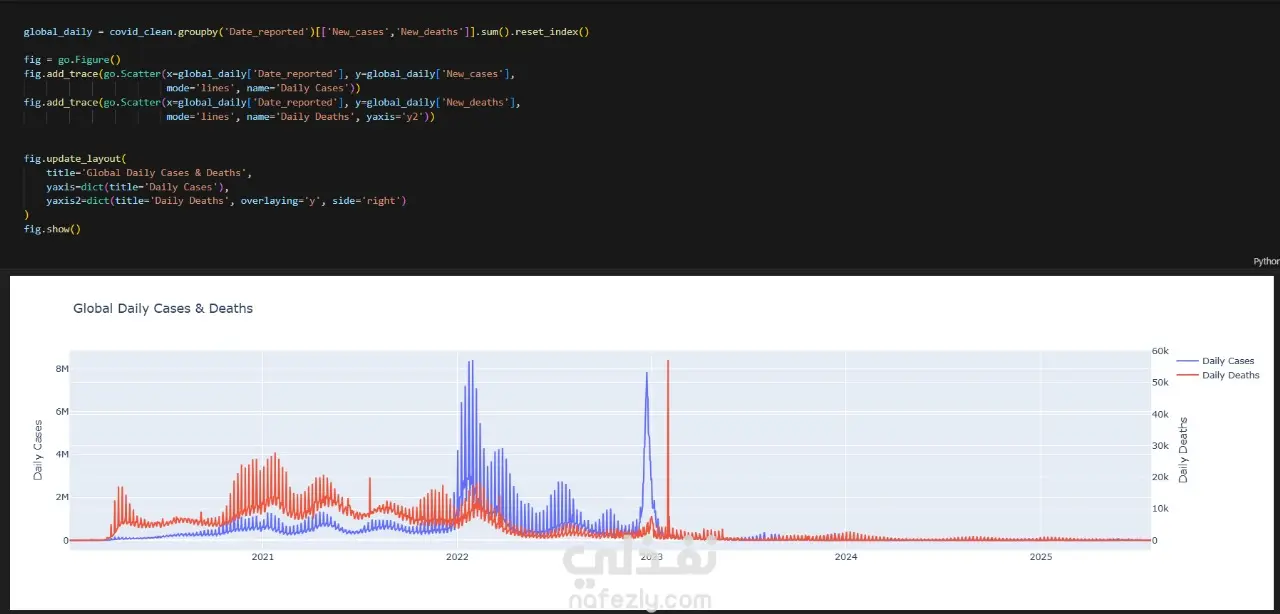
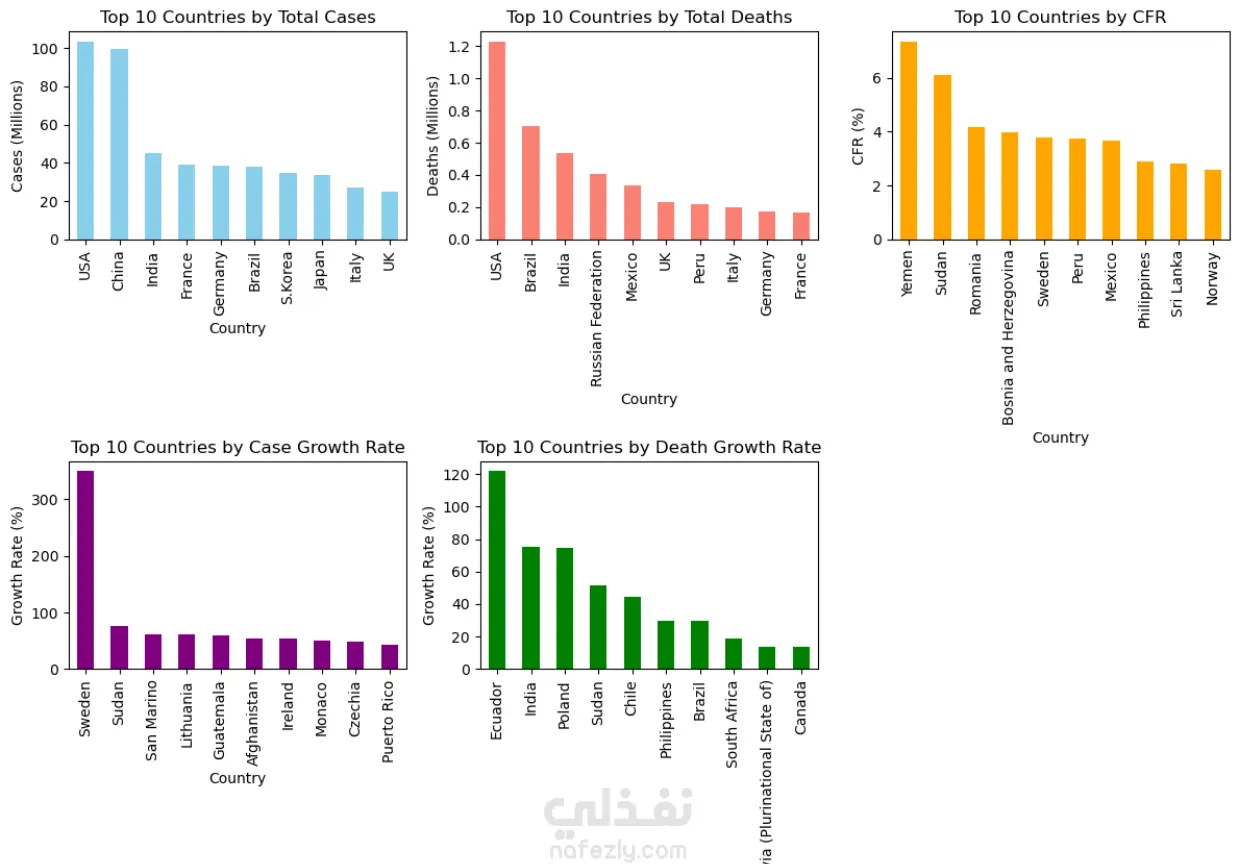
Analyzed real-world COVID-19 datasets to uncover trends and patterns in infection and recovery rates. The project involved cleaning and processing data using Python and Pandas, and creating clear and informative visualizations including line charts, bar charts, and heatmaps with Matplotlib and Seaborn. The insights generated helped understand how the pandemic evolved over time and highlighted key patterns in the spread and recovery of the virus. Tools & Technologies: Python, Pandas, Matplotlib, Seaborn
مهارات العمل
بطاقة العمل

طلب عمل مماثل