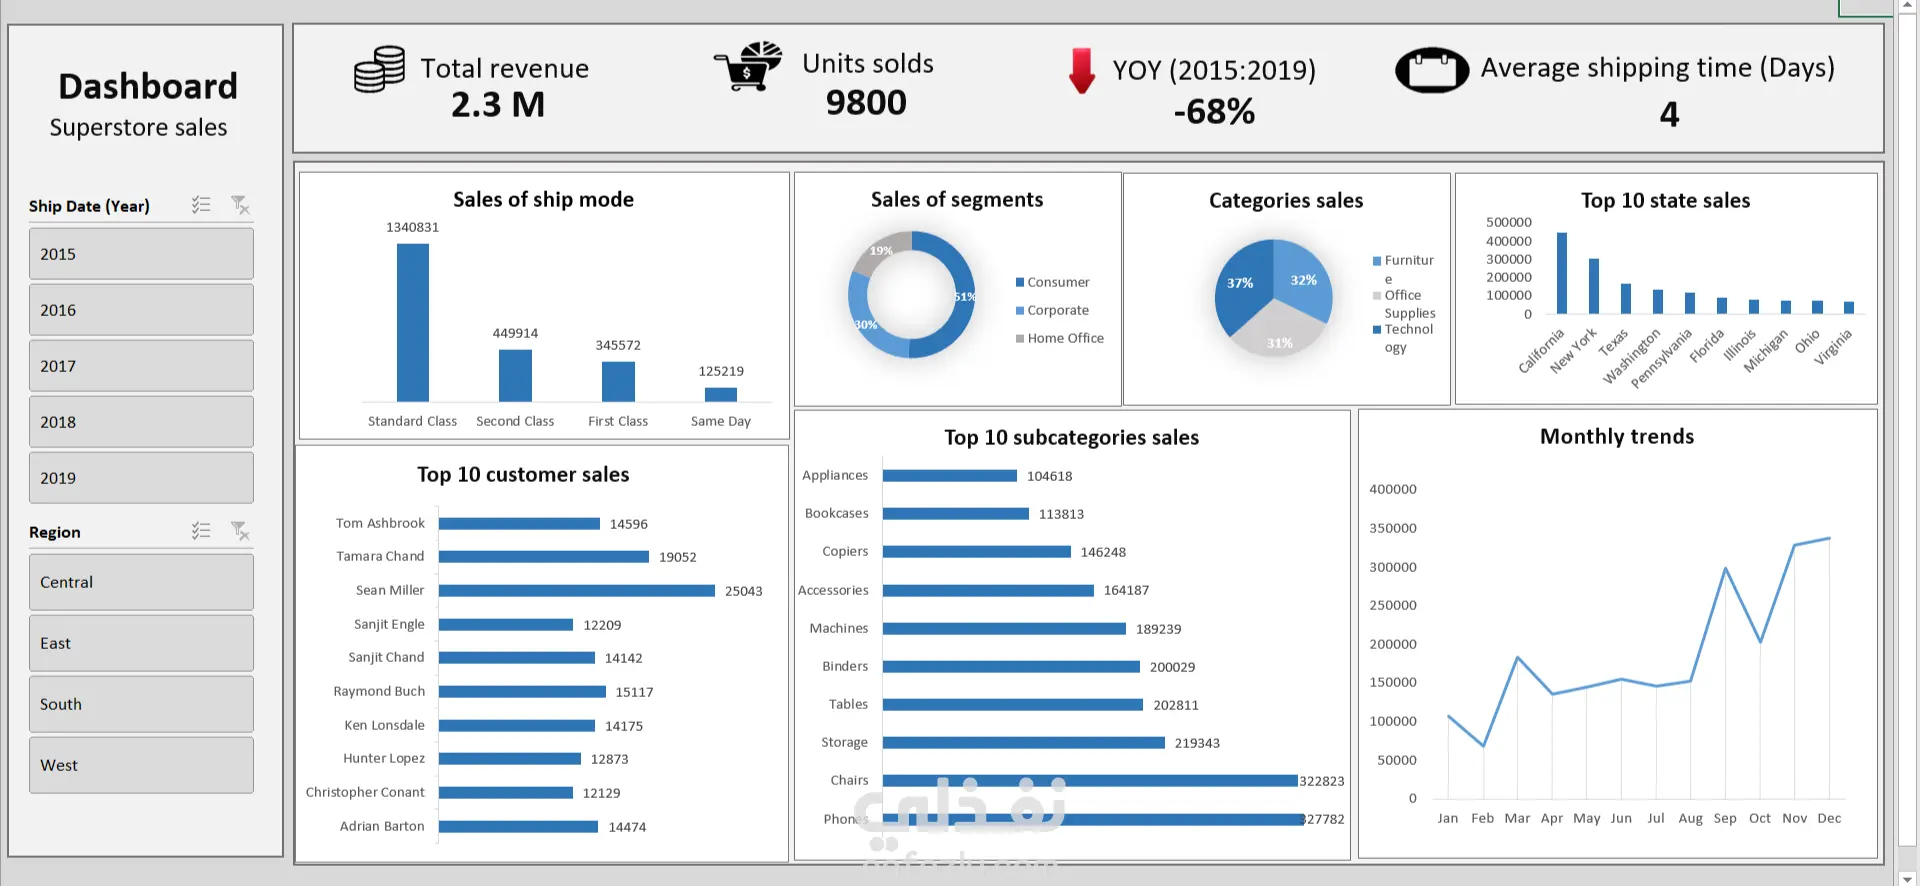
For this project, I started working with the Superstore Sales dataset to build an interactive Sales Performance Dashboard in Excel.
The dashboard summarizes key business metrics and helps visualize performance trends over time.
Key Insights:
💰 Total Revenue: 2.3M
📦 Units Sold: 9,800
📉 YoY (2015–2019): -68%
⏱️ Average Shipping Time: 4 days