AdventureWorks

تفاصيل العمل
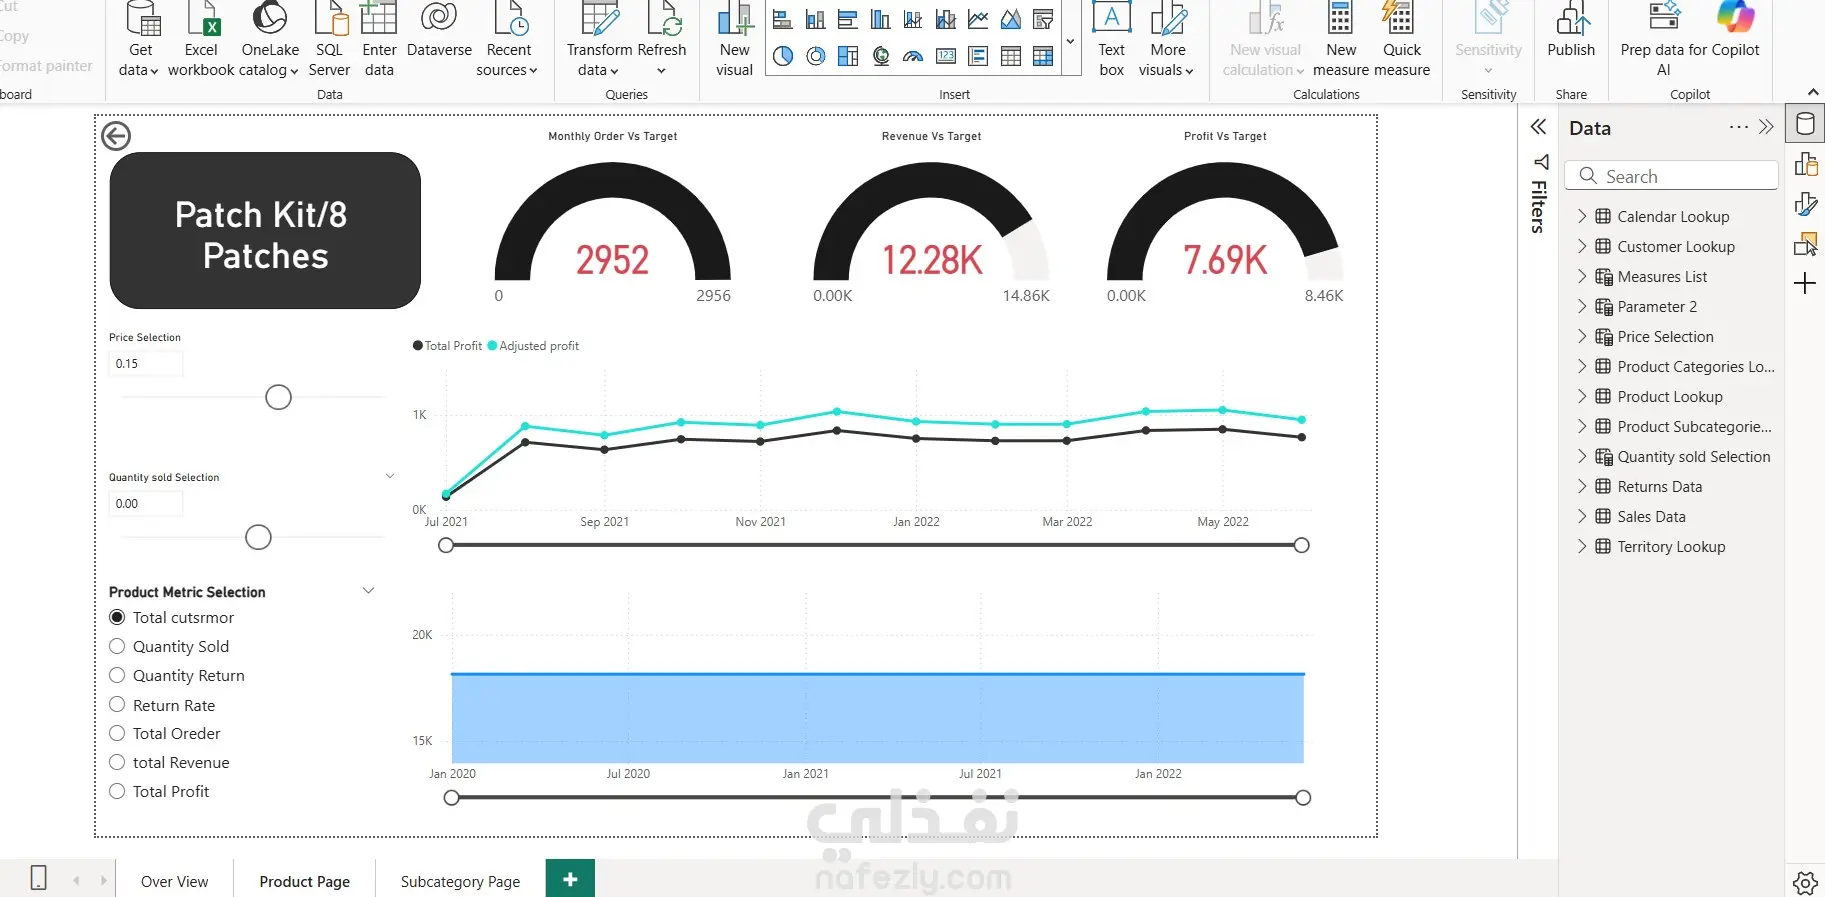
Cleaned and transformed data from multiple related tables (Sales, Customers, Products, and Geography) using Power Query. Built data model relationships to connect key business entities and ensure accurate reporting. Created DAX measures to calculate total sales, profit margins, average income, and customer segmentation (Low / Average / High). Designed dynamic visualizations including bar charts, line graphs, and slicers for region, product category, and sales trends. Delivered insights highlighting top-performing products, most profitable regions, and customer behavior patterns. Tools Used: Power BI, DAX, Power Query, Data Modeling, Data Visualization
مهارات العمل


