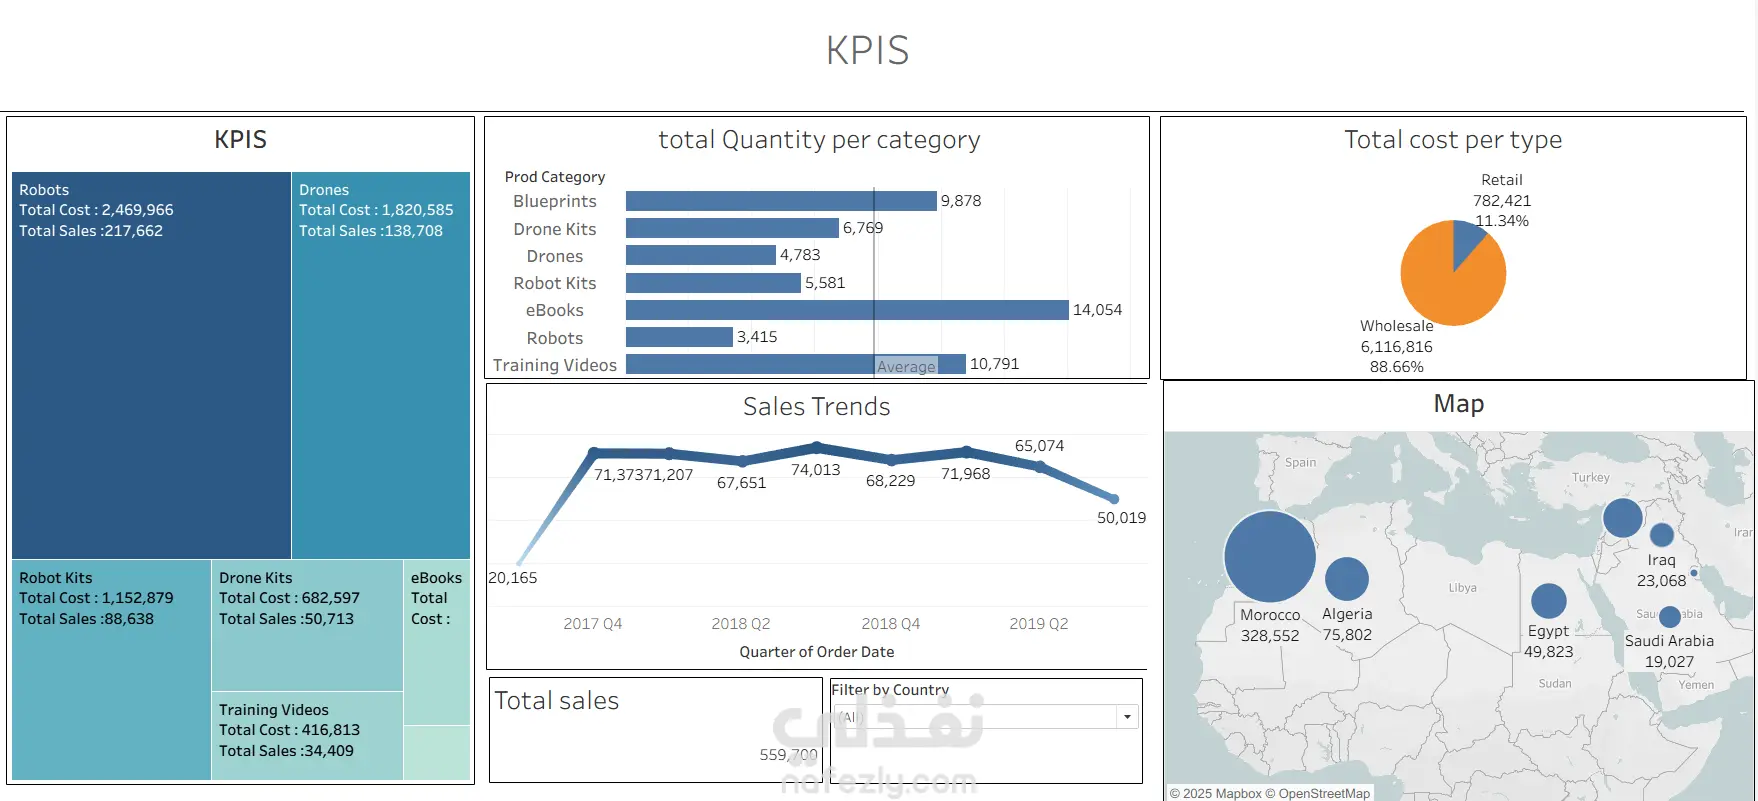
The dashboard highlights:
Key KPIs like total cost and sales.
Category analysis showing product quantities.
Cost breakdown between Retail and Wholesale.
Interactive map showing the top countries (Morocco leading ).
Sales trends show 2018 as one of the strongest years.
I also learned how to use interactive filters (slicers) to let users explore the data freely