Data Analysis & Visualization Dashboard using Power BI
تفاصيل العمل
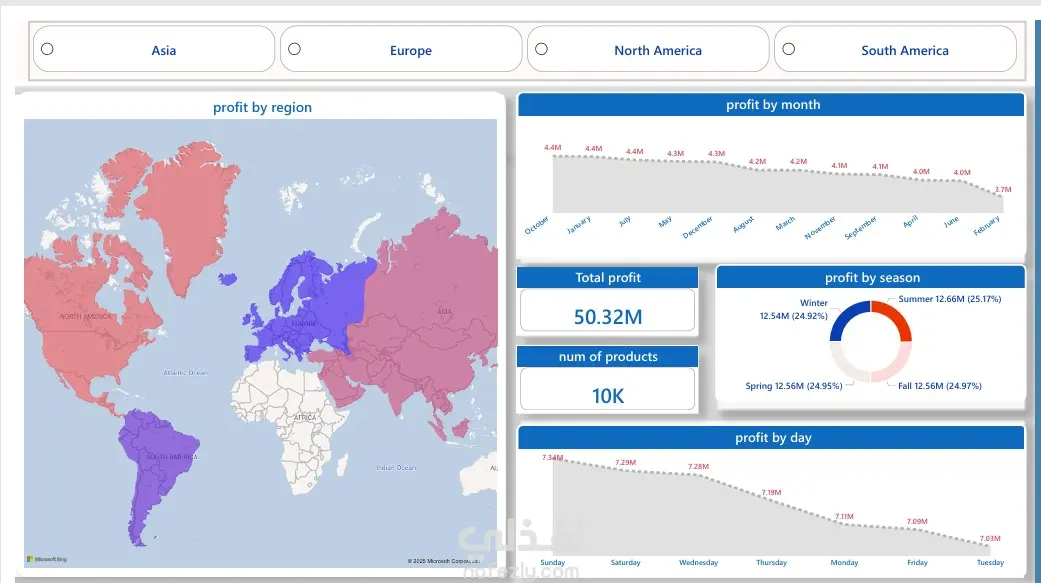
Designed and developed an interactive Power BI dashboard to analyze and compare profits across multiple countries. The dashboard visualizes key insights, trends, and performance indicators through maps, charts, and interactive filters.
مهارات العمل