Tools: Python (Pandas, Matplotlib, Plotly)
Process:
Data Cleaning: handled missing values, standardized date formats, created new features
(e.g., Y earMonth, combined make + model into product name).
Exploratory Data Analysis (EDA): identified sales trends, top-selling models, and
geographical sales distribution.
Visualization: built clear and interactive charts to communicate insights effectively .
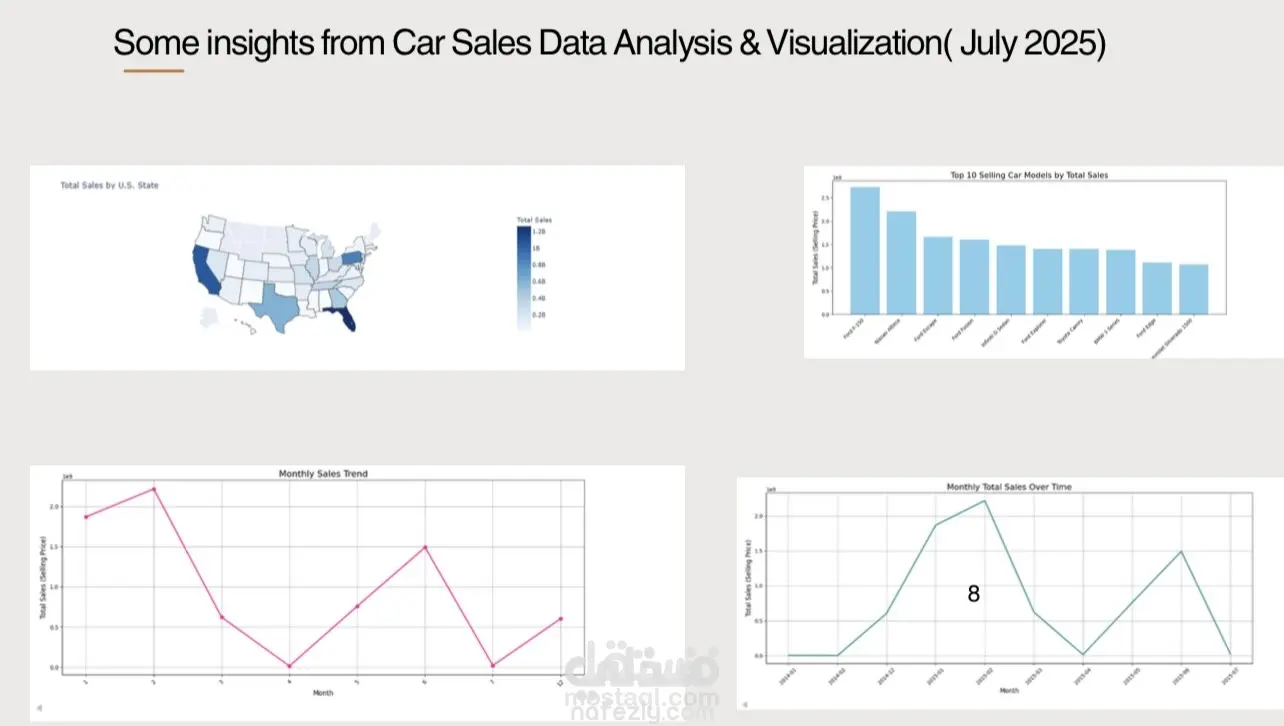
Key Insights:
Sales showed seasonal trends across months
Top 10 car models generated the majority of revenue
Certain U.S. states consistently outperformed others in total sales
Long-term time-series analysis revealed fluctuations and potential seasonality in sales
performance