E-commerce Performance Dashboard

تفاصيل العمل
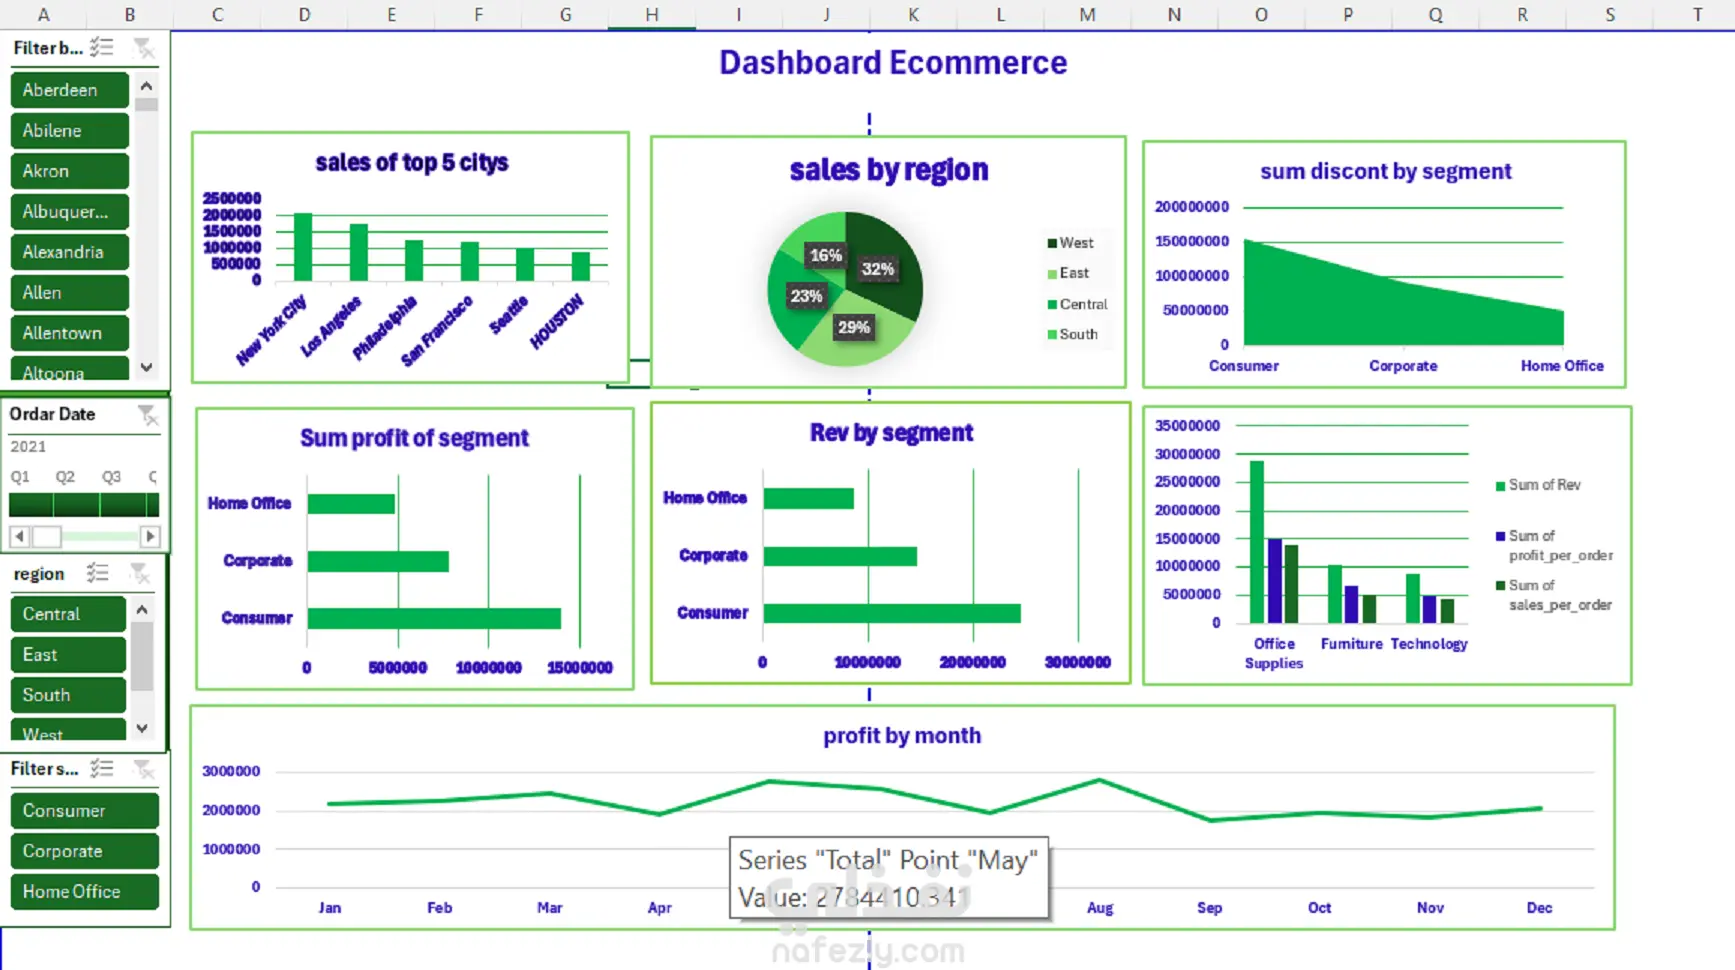
Goal: To design and implement an interactive e-commerce dashboard providing a comprehensive analysis of sales, revenue, profit, and discount distribution. The aim was to offer clear insights into financial performance across geographical regions and customer .segments to support data-driven business decisions Tools Used: Microsoft Excel Key Insights: Customer Segment Performance: The Consumer segment consistently generated the highest sum of both profit and revenue, followed by the Corporate segment. This indicates that the largest volume and value of transactions come from individual consumers. Discount Strategy: The highest amount of discounts was allocated to the Consumer segment, which is consistent with its highest transaction volume. This highlights the effectiveness or necessity of discounts in driving sales for the primary customer group. Geographical Contribution: Sales are distributed relatively evenly across regions, with the West and Central regions holding the largest shares. New York City, Los Angeles, and Philadelphia were identified as the top 5 performing cities. Monthly Profit Trend: The monthly profit analysis shows a fluctuating trend, with May representing a key performance peak with a value of approximately 2,784,410.
مهارات العمل


