Comprehensive Sales Dashboard Analysis

تفاصيل العمل
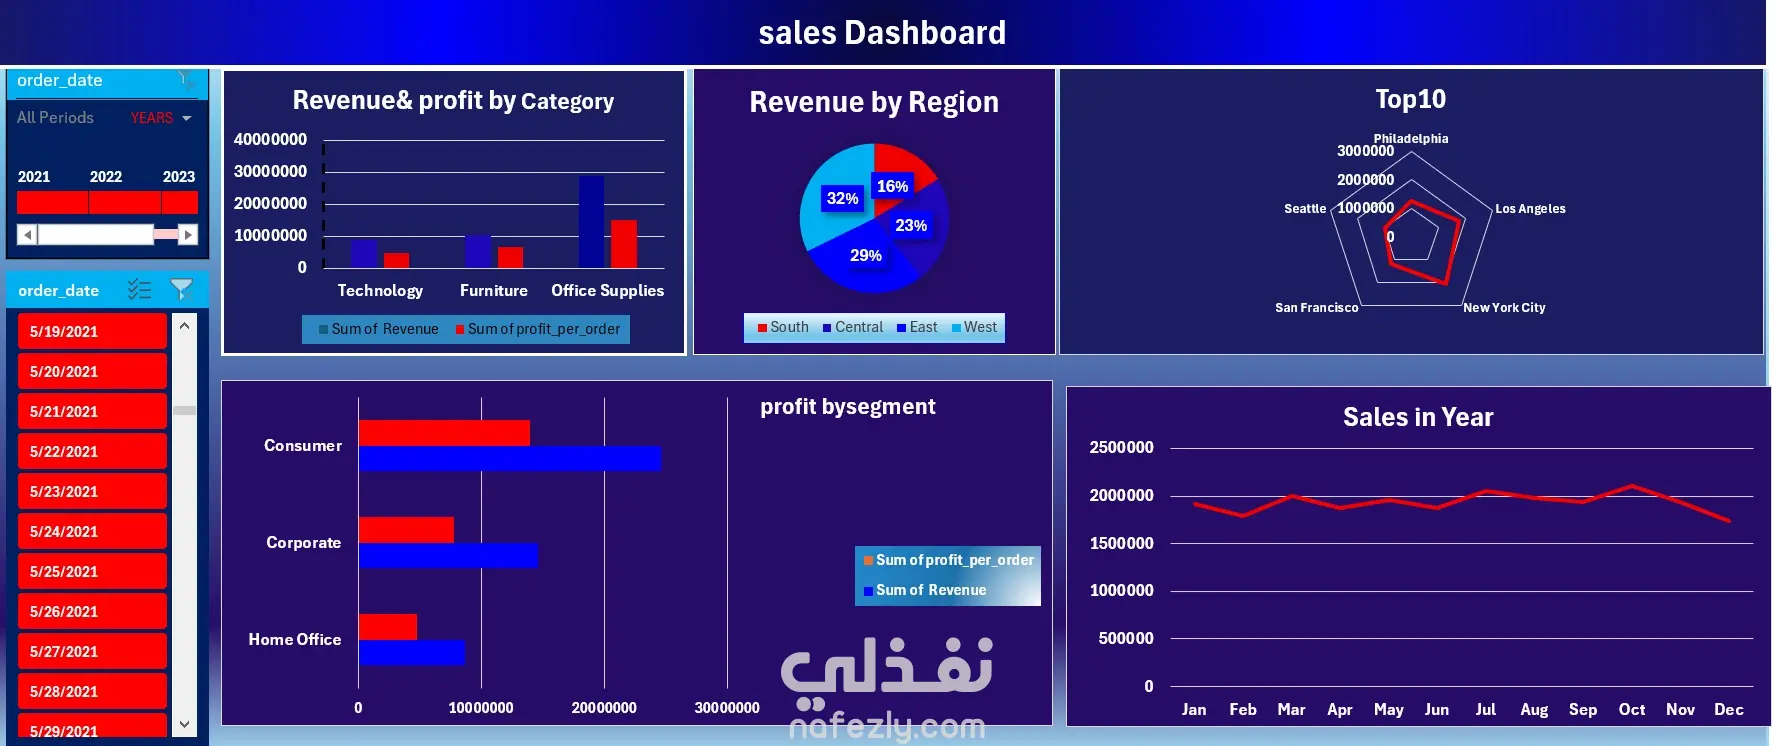
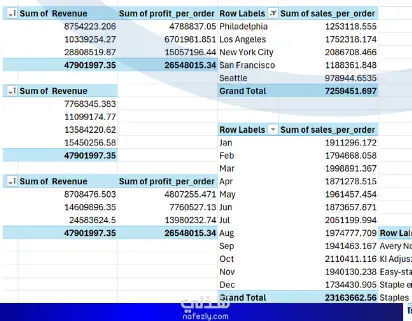
Goal: To develop a dynamic sales dashboard aimed at analyzing annual performance, profitability across different product categories, and sales distribution by region and customer segment. The primary objective was to transform complex sales data into clear, actionable insights for strategic decision-making. Tools Used: Microsoft Excel Key Insights: Profitability & Category Performance: The "Office Supplies" category generated the highest total revenue. However, a closer look at the "Technology" and "Furniture" categories is warranted to improve profit per order. Customer Segmentation: The "Consumer" segment drives the highest volume of both revenue and profit compared to the "Corporate" and "Home Office" segments Seasonal Trends: Sales exhibit clear seasonality, typically peaking in the later months of the year (such as October and November). Geographical Analysis: The analysis identified top-performing cities like San Francisco and New York City as key markets for focused expansion and resource allocation.
مهارات العمل
بطاقة العمل

طلب عمل مماثل