Sales & Customer Retention Analysis

تفاصيل العمل
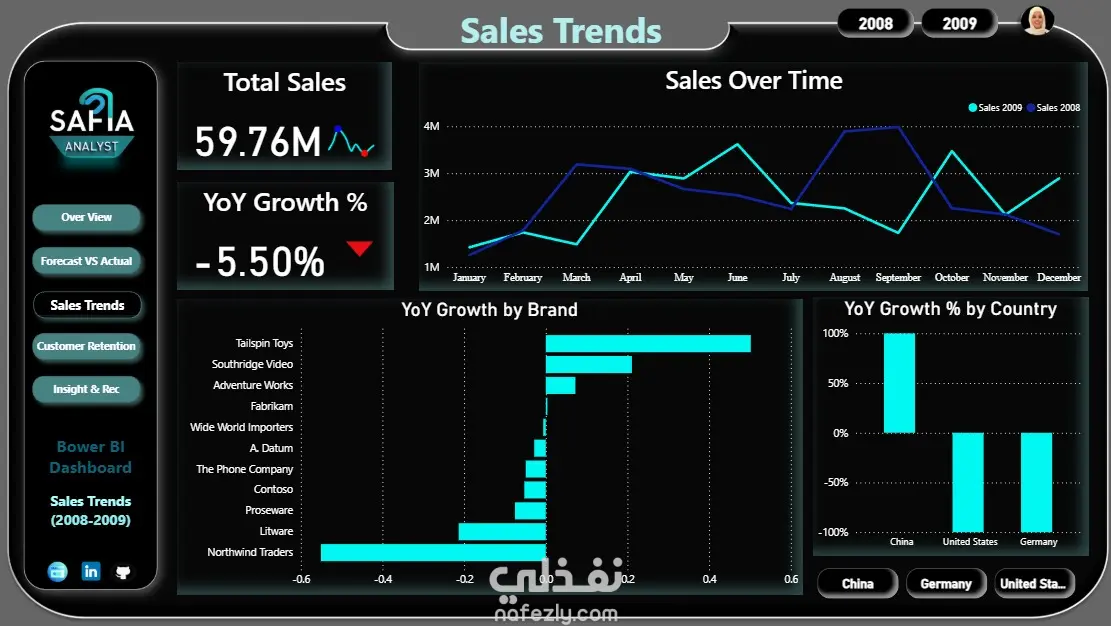
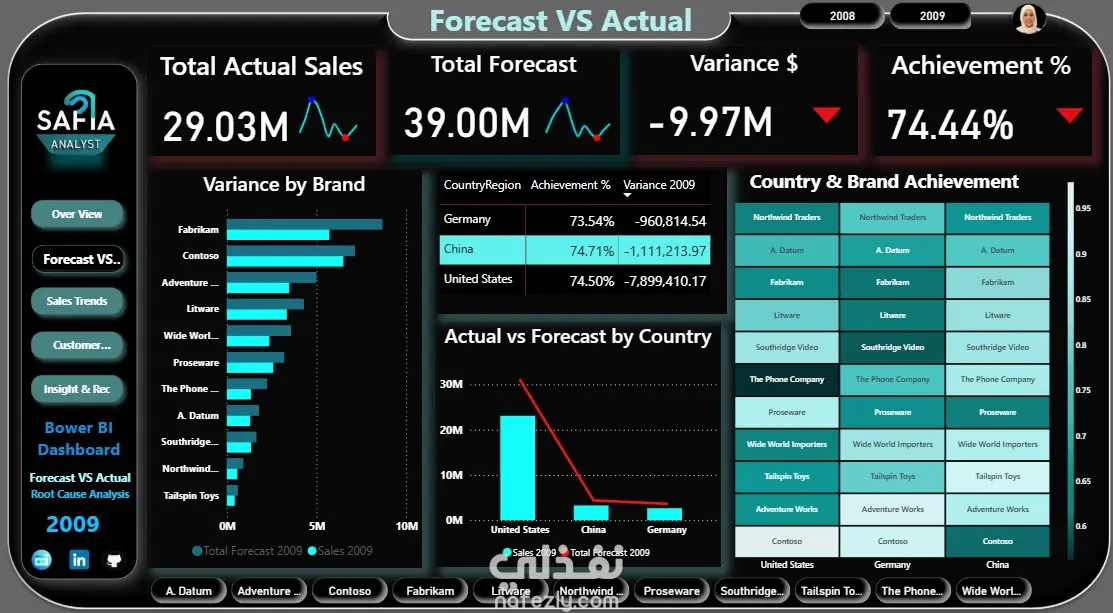
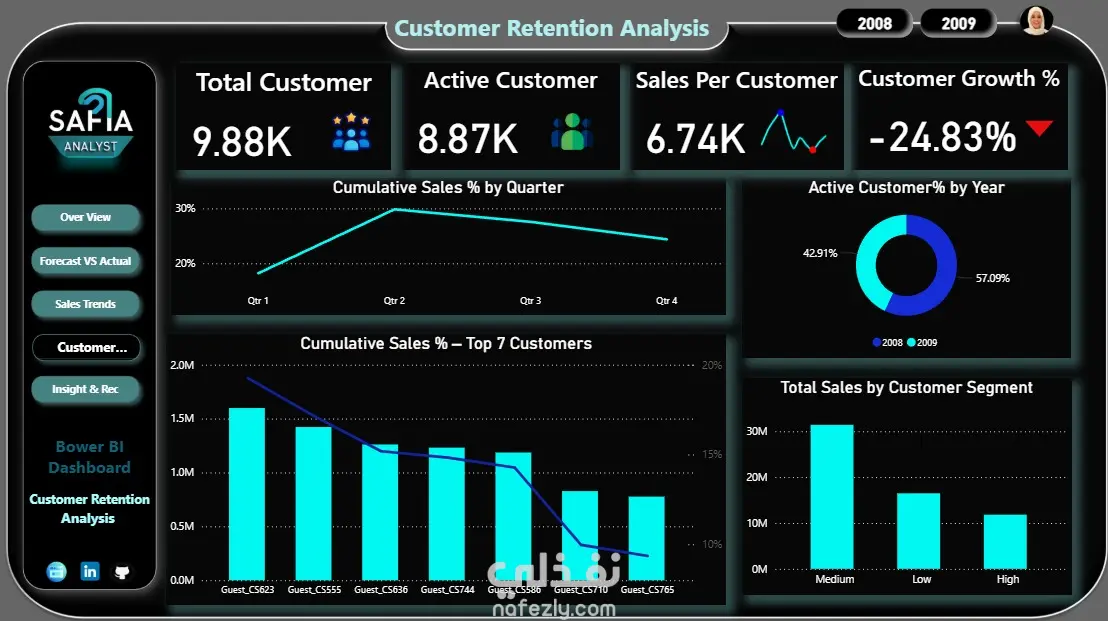
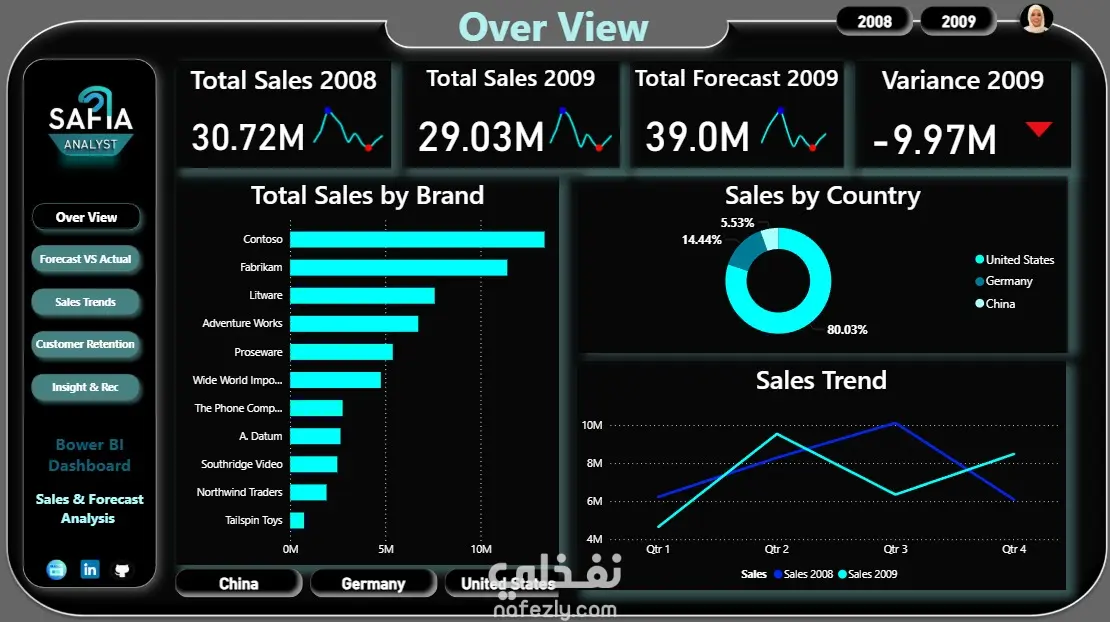
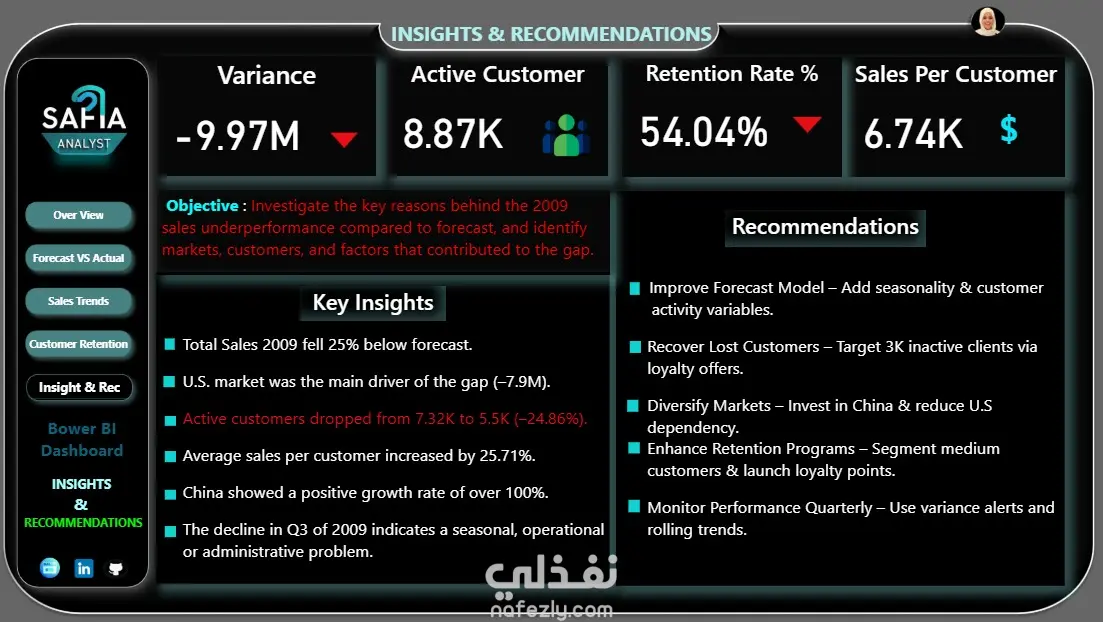
I believe every number hides a story waiting to be uncovered. Every chart, every fluctuation, every spike or drop — it all means something deeper. This week, I built an interactive Power BI dashboard to analyze sales and customer retention between 2008 and 2009 for a major sales company. At first glance, the data seemed simple — sales dropped, forecasts missed. But when I looked closer, the numbers began to speak. 🔹 –29.56M variance. Not just a shortfall — it was a sign that forecasting models were missing key factors like seasonality and customer behavior. 🔹 U.S. sales fell from 9.80M to 7.39M (–24.6%). Behind the drop was overreliance on one market — a single point of failure that shaped the entire year’s performance. 🔹 Active customers declined from 7.32K to 5.5K (–24.8%), but average sales per customer rose by 25.7% — fewer buyers, but stronger ones. A shift in loyalty, not demand. 🔹 China’s sales doubled. A quiet success story — proof that opportunities often grow where the focus is weakest. Even Q3’s dip had its message: seasonal patterns and operational issues left unaddressed. By the end, this dashboard wasn’t just data — it was a roadmap for smarter decisions: Build better forecast models. Reconnect with lost customers. Diversify markets and reduce U.S dependency. Strengthen retention and track performance quarterly. Because in data, every number has a voice — you just need to listen carefully. Explore the interactive dashboard here: https://www.dropbox.com/scl/fi/vtbcv68x3ra6fdoyiipcb/Sales-Customer-Retention-Analysis.pbix?rlkey=bccb0aws3rybwj40ep8qmv5qn&st=495nb21f&dl=0
مهارات العمل
بطاقة العمل

طلب عمل مماثل


