Interactive Traffic Risk Explorer Dashboard – Data Analysis & Visualization
تفاصيل العمل
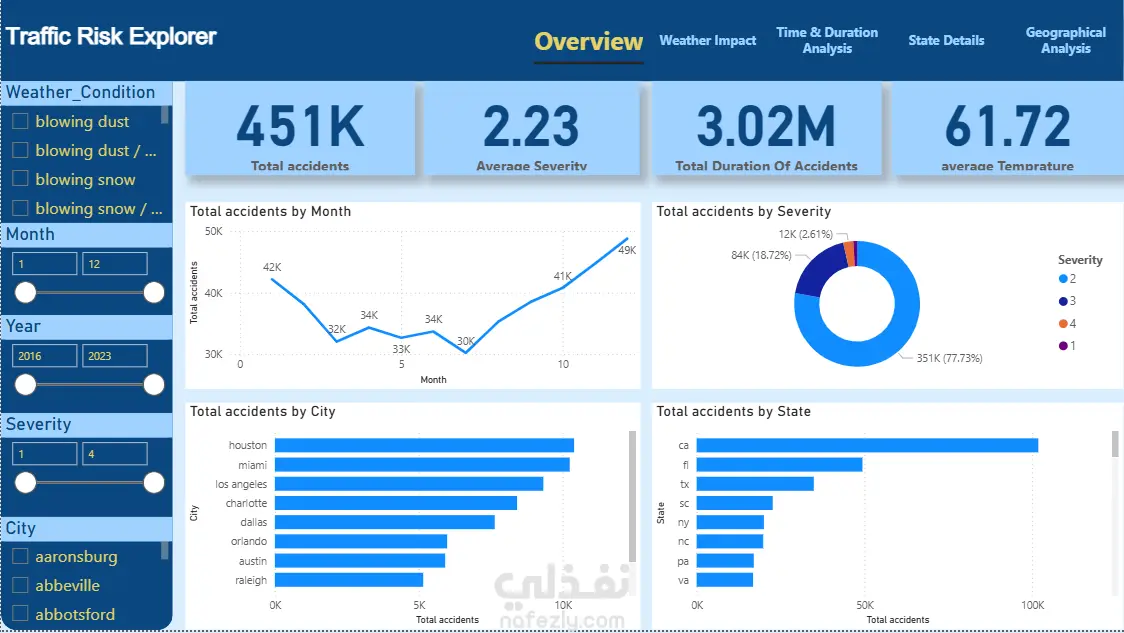
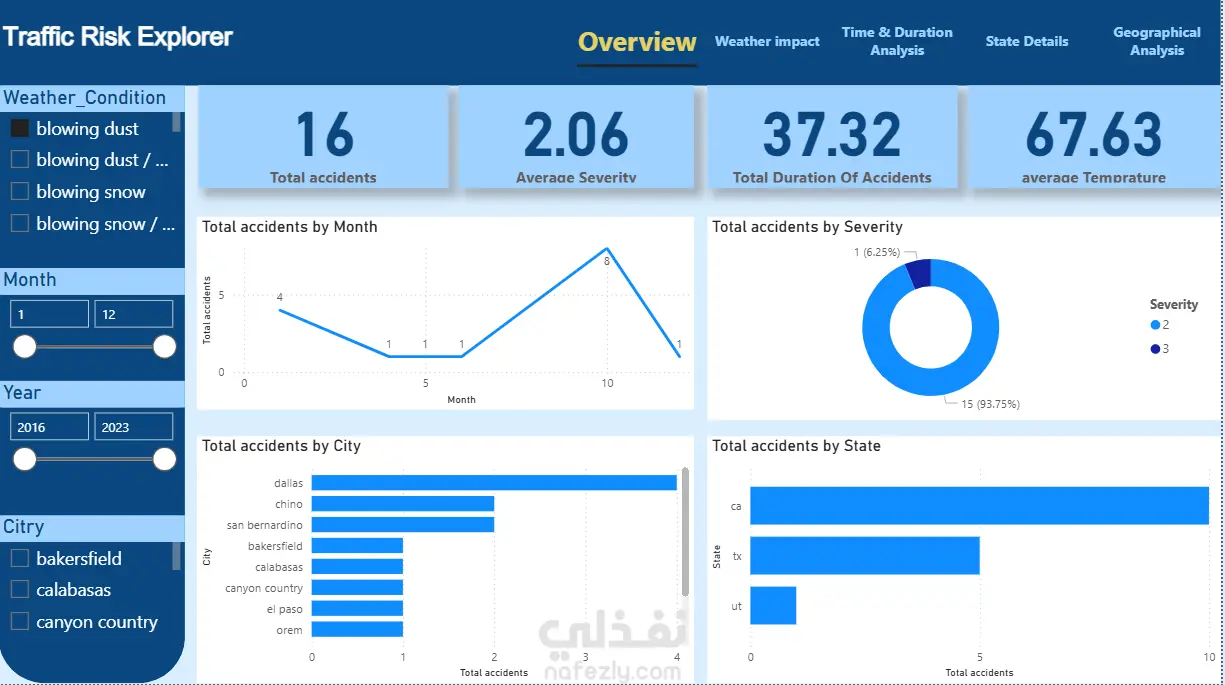
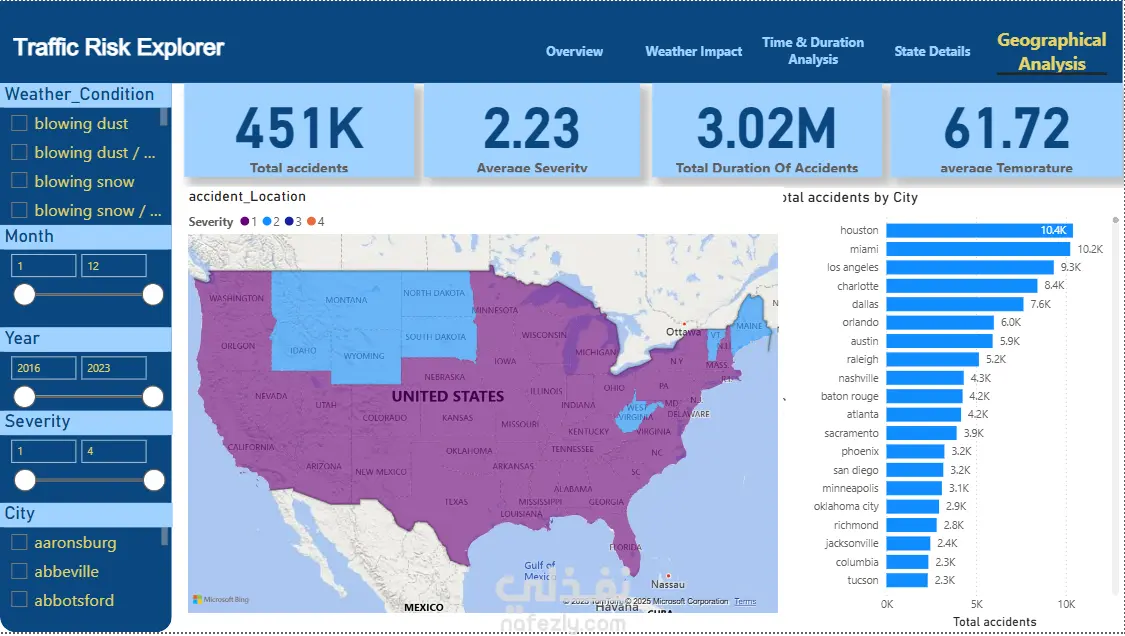
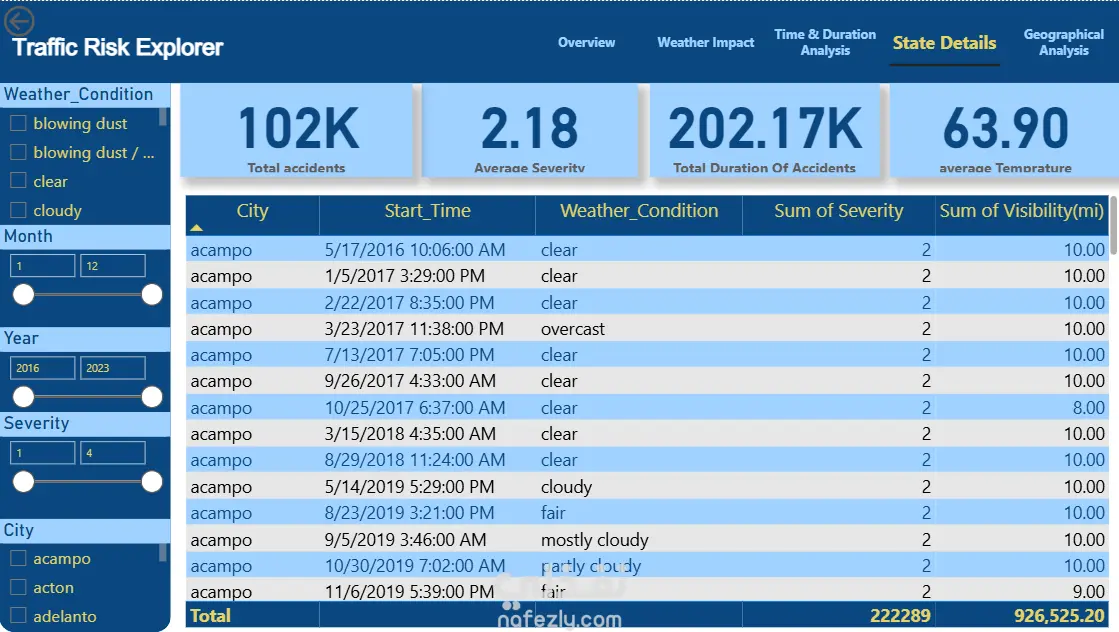
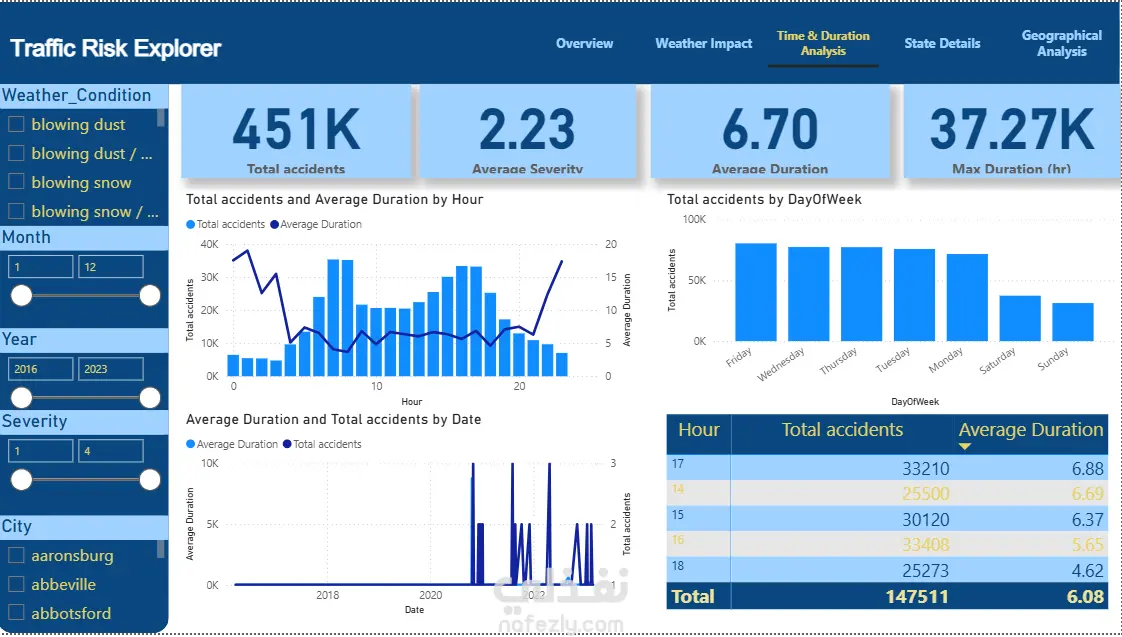
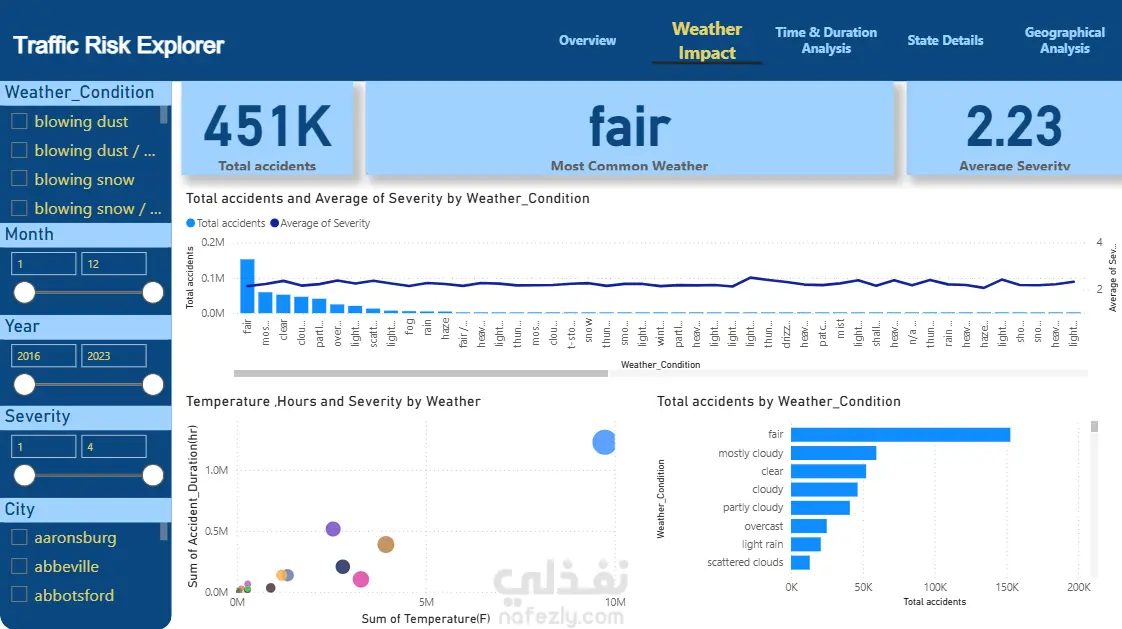
Unlock insights from traffic accident data with my Traffic Risk Explorer Dashboard! 🚦 This project provides a comprehensive analysis of traffic accidents across different cities and states. Using interactive visualizations, you can explore: Total accidents and average severity Monthly trends of accidents Accident distribution by city and state Breakdown of accidents by severity levels Impact of weather conditions on accidents The dashboard is designed to be user-friendly, interactive, and visually appealing, making it easy for analysts, city planners, or insurance companies to extract actionable insights. Key Features: Interactive filters by month, year, city, and severity Detailed graphs and charts for quick analysis Focused on data-driven decision-making Clean and professional dashboard design This project showcases my skills in data visualization, data analysis, and dashboard design, perfect for business intelligence and analytics applications.
مهارات العمل