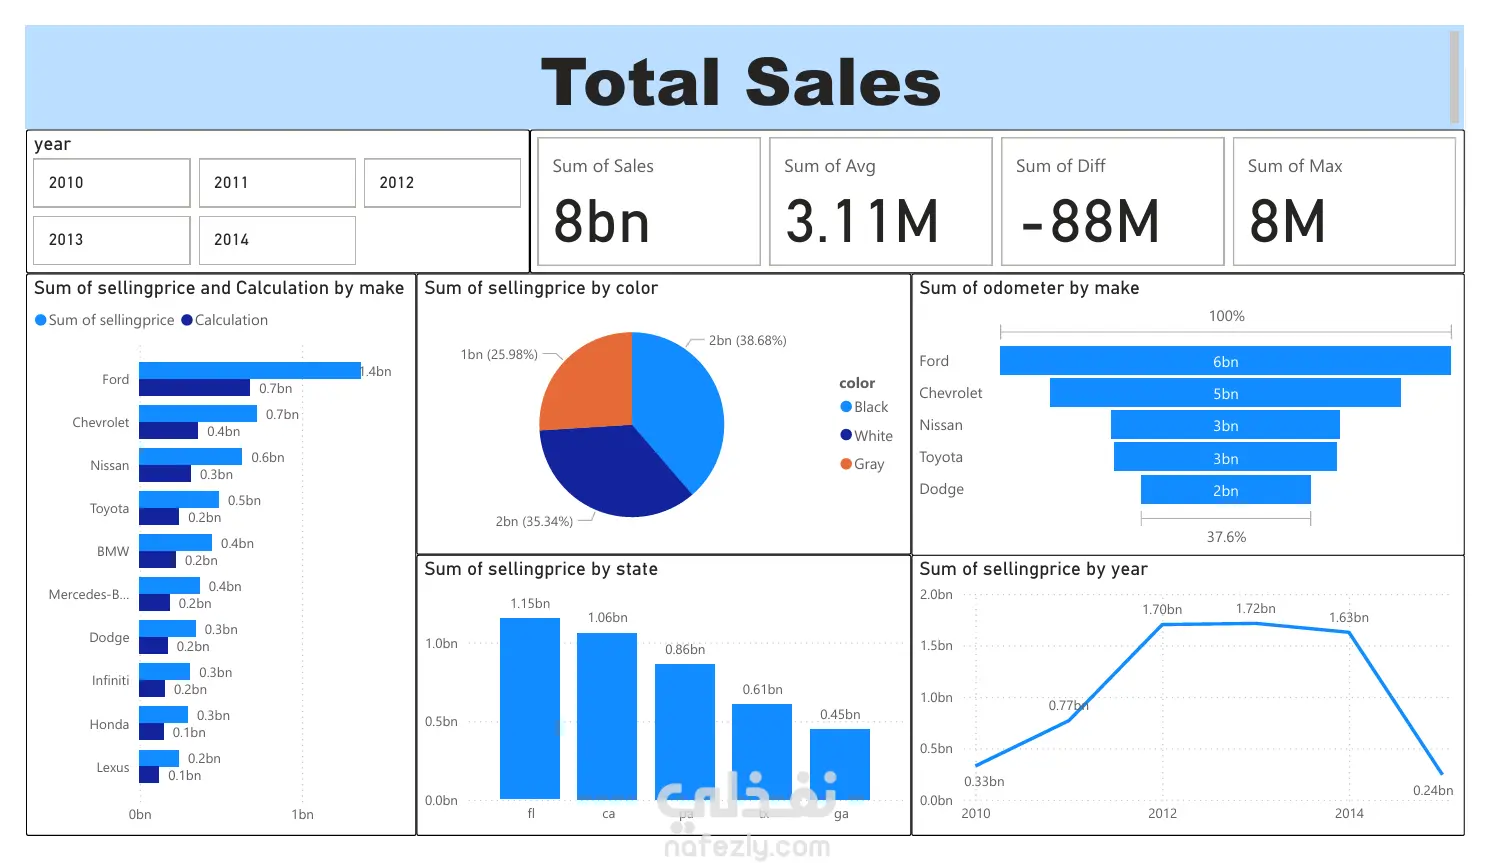
This dashboard visualizes and analyzes car sales data from 2010 to 2014 using Power BI.
It includes:
Total sales summary and yearly comparison
Sales breakdown by car make, color, and state
Odometer value distribution by manufacturer
Selling price trends over time
Key metrics such as total sales, averages, and maximum values
The goal of the dashboard is to provide clear insights into car sales performance and trends using interactive charts and a clean, professional layout.