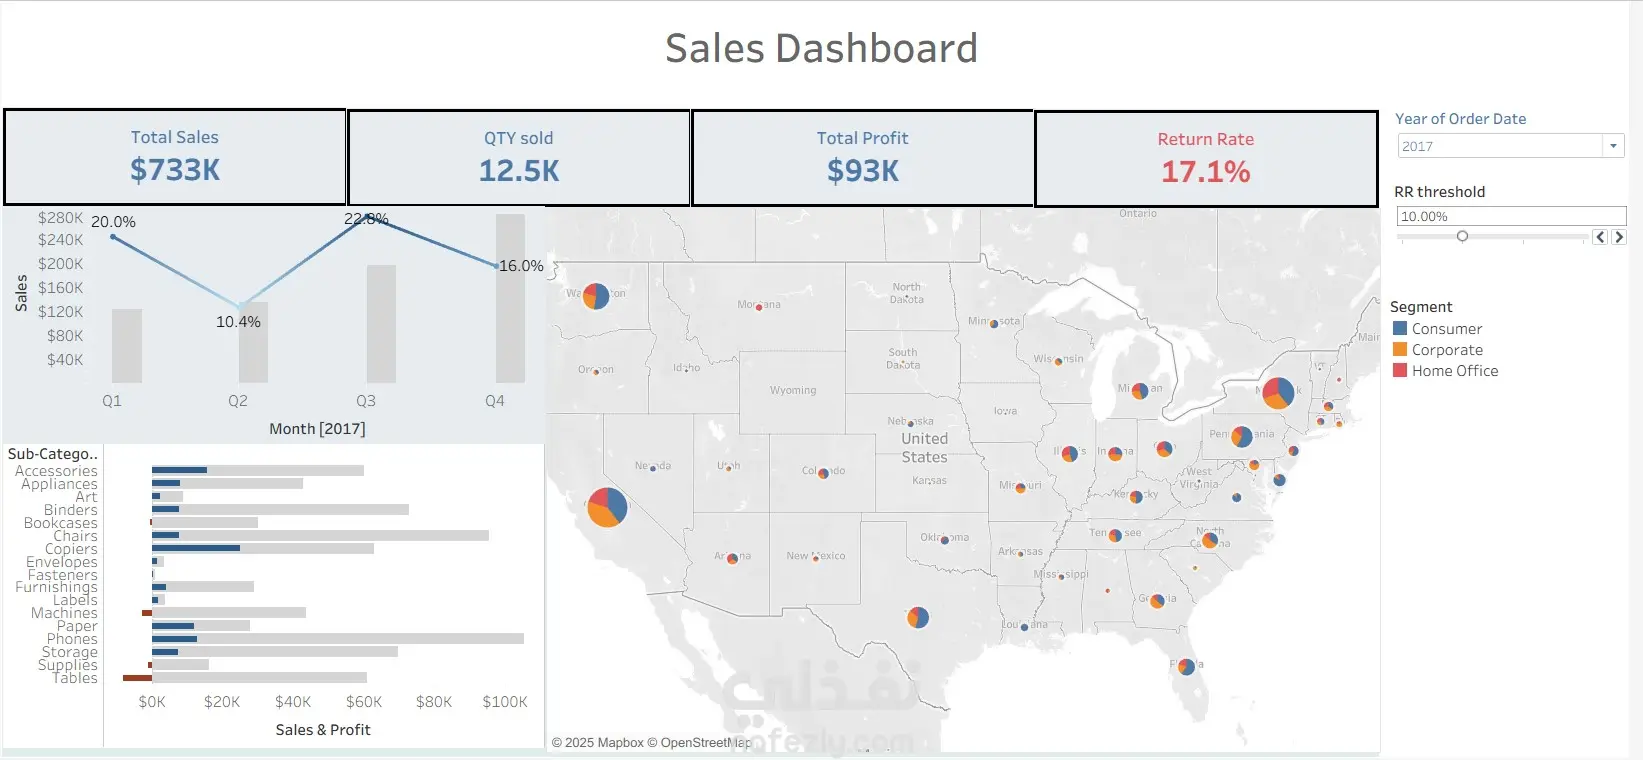
This interactive Sales Dashboard provides a comprehensive overview of business performance, enabling users to explore data dynamically and uncover insights in real time.
Key features include:
Fully interactive filtering: Users can instantly filter results by state, product category, customer segment, or time period simply by clicking any visual element — whether it’s a point on the map, a quarter in the trend line, or a product in the sales breakdown.
Real-time insights: All charts and KPIs update automatically upon interaction, allowing decision-makers to focus on specific regions or time frames without navigating multiple pages.
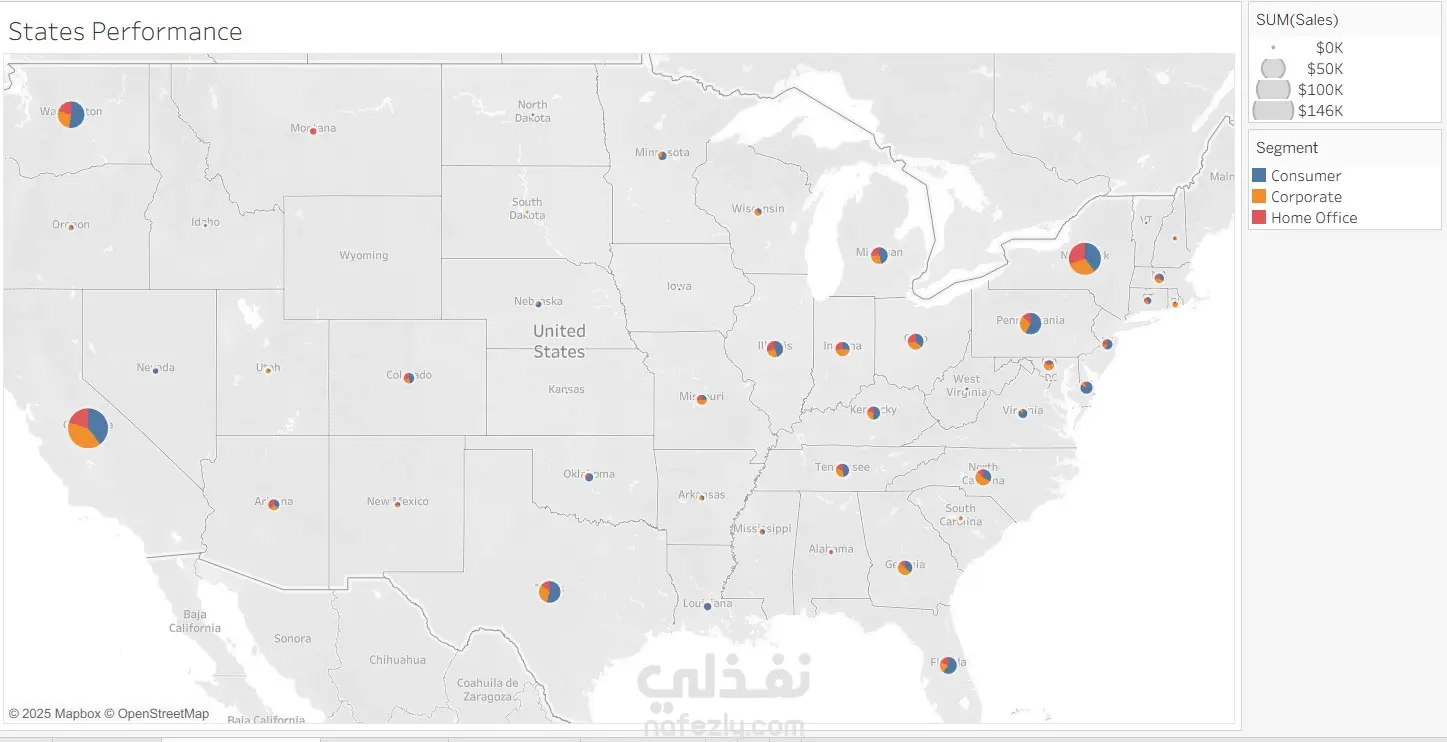
Geospatial analysis: A map visualization highlights sales distribution and segment performance across the United States, making it easy to spot regional trends and high-performing markets.
Performance tracking KPIs: The dashboard summarizes total sales, quantity sold, profit, and return rate at a glance, helping stakeholders monitor business health efficiently.
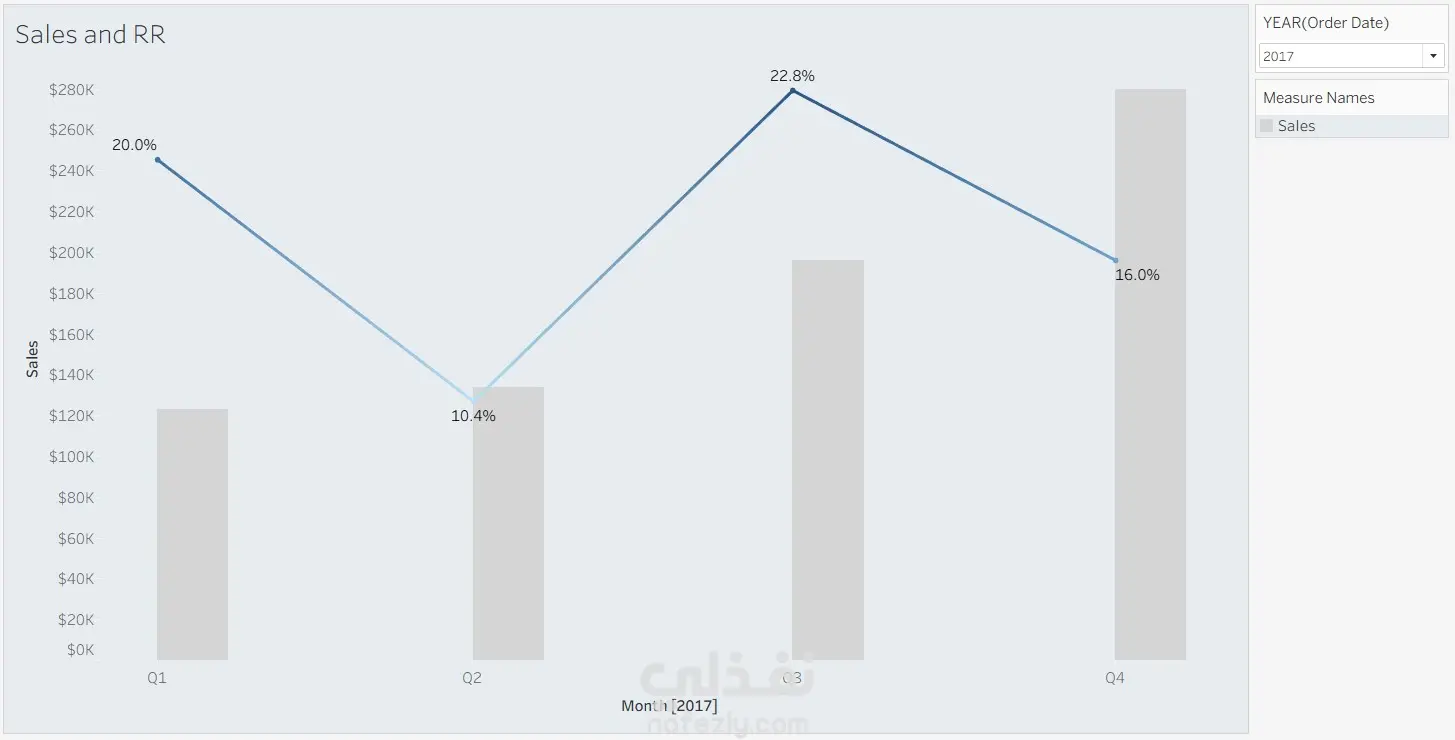
Quarterly trend visualization: The combination of bar and line charts reveals quarterly sales changes and percentage growth, supporting seasonal performance analysis.
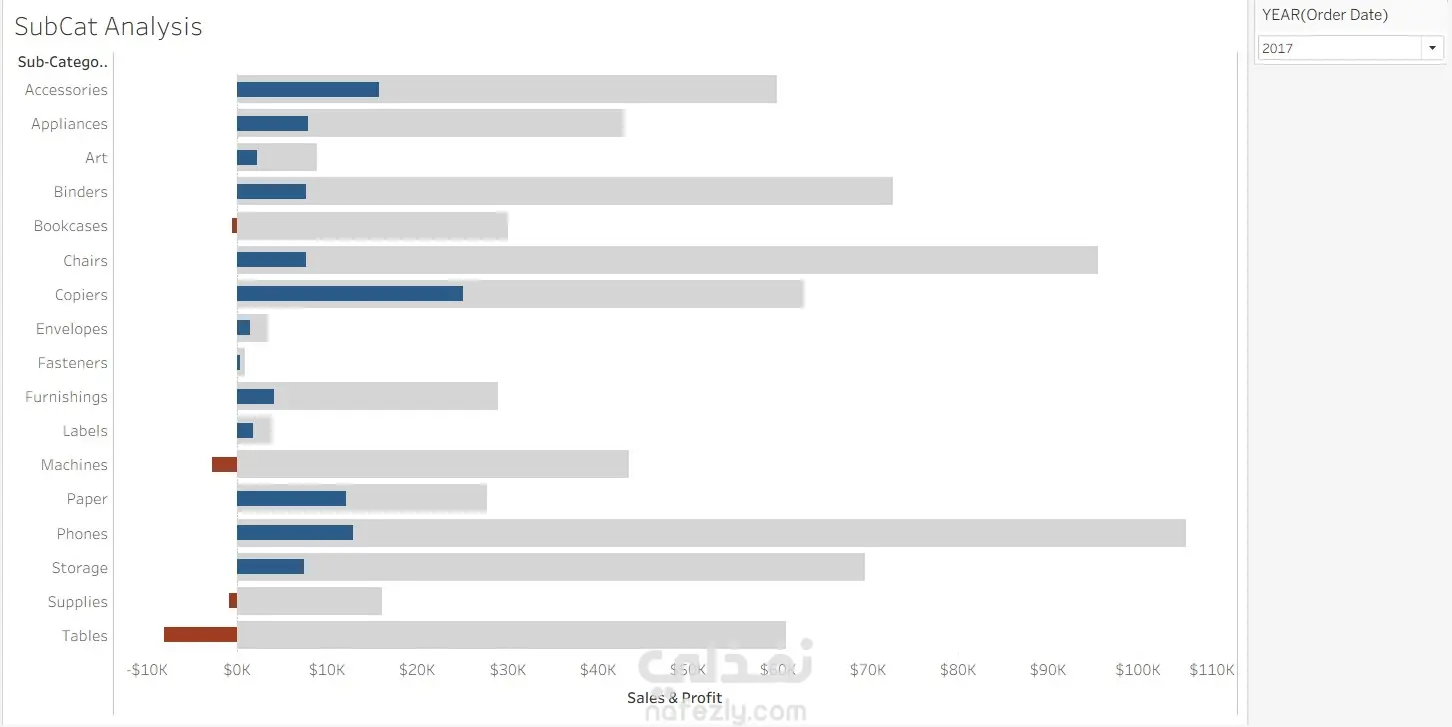
Detailed product breakdown: Sub-category comparisons of sales and profit help identify which product lines contribute most to revenue and profitability.