Chicago Food Inspections Analysis
After weeks of diving into real-world data, I'm excited to share my latest project where I analyzed thousands of food inspection records in Chicago to uncover patterns, trends, and insights using Python & Machine Learning.
Tech Stack:
Pandas, NumPy, Seaborn, Matplotlib, Folium, WordCloud, Scikit-learn
Key Highlights:
Cleaned and preprocessed messy real-world data
Visualized geographical inspection data on interactive maps
Built a predictive model to classify Pass/Fail results (Accuracy: {your accuracy here, e.g., 0.84})
Extracted most common violations using WordClouds
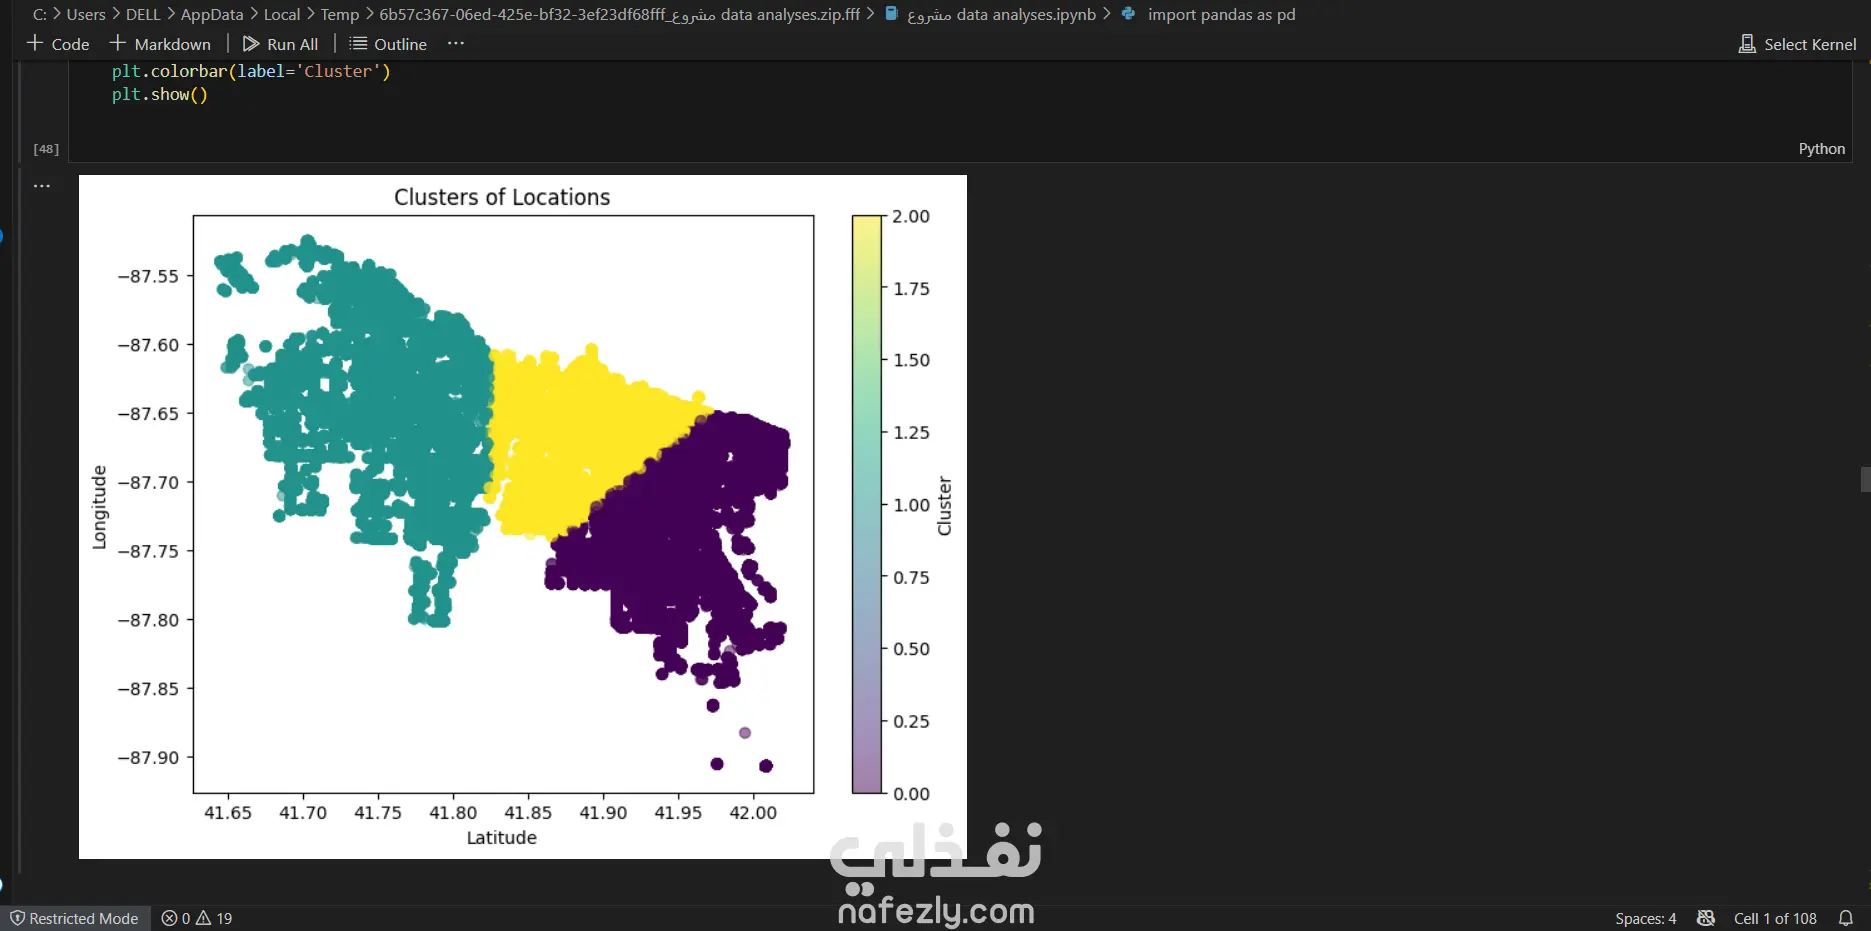
Performed clustering with KMeans & regression analysis
Found seasonal/monthly patterns in failure rates
Created interactive heatmaps for failed inspections
Discovered the top cities and facility types with the highest failure rates