Objective: To design and build an interactive business intelligence dashboard to analyze the short-term property rental market across Saudi Arabia. The primary goal was to provide investors, property managers, and market analysts with a comprehensive tool to identify trends, evaluate pricing, and make data-driven investment decisions.
Key Features:
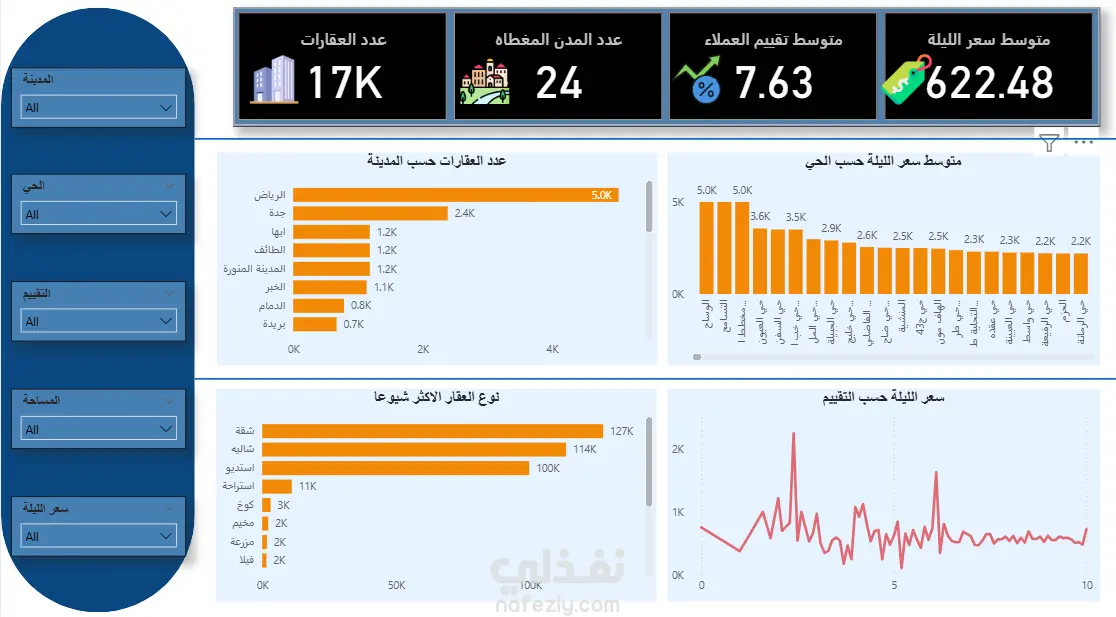
Market Overview: High-level KPIs provide a snapshot of the market, including total property listings (17K), number of cities covered (24), average customer rating (7.63), and the average nightly rate ($622.48).
Geographic Analysis: Visualizes property distribution by city and average nightly rates by neighborhood, immediately identifying Riyadh as the largest market with 5,000 listings.
Inventory & Demand Analysis: A dedicated chart highlights the most common property types, revealing that apartments ("شقة") are the most prevalent, followed by chalets ("شاليه").
Dynamic Filtering: Users can interactively filter the entire dashboard by city, neighborhood, property type, and price range, allowing for highly specific and customized analysis.
Pricing Insights: A line chart correlates nightly rates with customer ratings, helping to understand the relationship between price and perceived value.
Impact: The dashboard successfully consolidates thousands of property listings into a clear, actionable format. It empowers users to perform competitive analysis, optimize rental pricing strategies, and identify underserved neighborhoods or high-demand property types, ultimately driving profitability.