Objective: To develop a comprehensive business intelligence dashboard that analyzes flight punctuality and identifies key factors contributing to delays. The goal was to provide stakeholders with actionable insights into airline performance, seasonal trends, and operational efficiency across various routes.
Key Features:
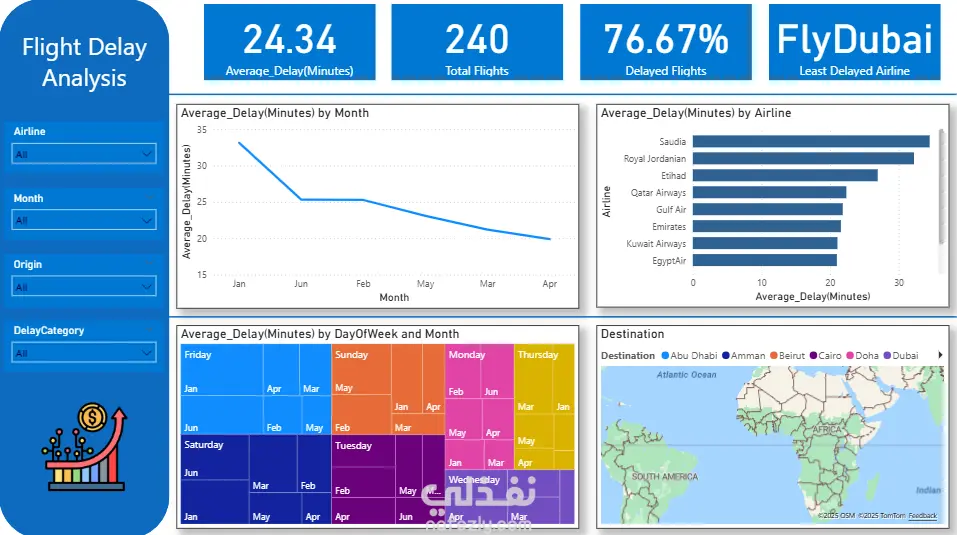
KPI Monitoring: High-level scorecards display critical metrics, including an average delay of 24.34 minutes, total flights analyzed (240), and the overall percentage of delayed flights (76.67%).
Comparative Analysis: A bar chart ranks airlines by their average delay, providing a clear performance benchmark and identifying FlyDubai as the most punctual carrier.
Trend Identification: A time-series line chart visualizes delay trends by month, revealing a peak in January, while a detailed treemap breaks down delay patterns by day of the week and month.
Interactive Slicers: Users can dynamically filter the entire report by airline, month, origin, and delay category to drill down into specific areas of interest.
Impact: This dashboard transforms raw flight data into a clear, interactive, and insightful tool. It empowers users to quickly identify performance bottlenecks, compare carriers, and understand the temporal patterns of delays, supporting data-driven decisions for operational improvements.