Objective: To design and implement a comprehensive, interactive dashboard that provides key insights into the company's workforce demographics, structure, and financial investments. The goal was to empower the HR department and leadership with data-driven tools for strategic planning and decision-making.
Key Features:
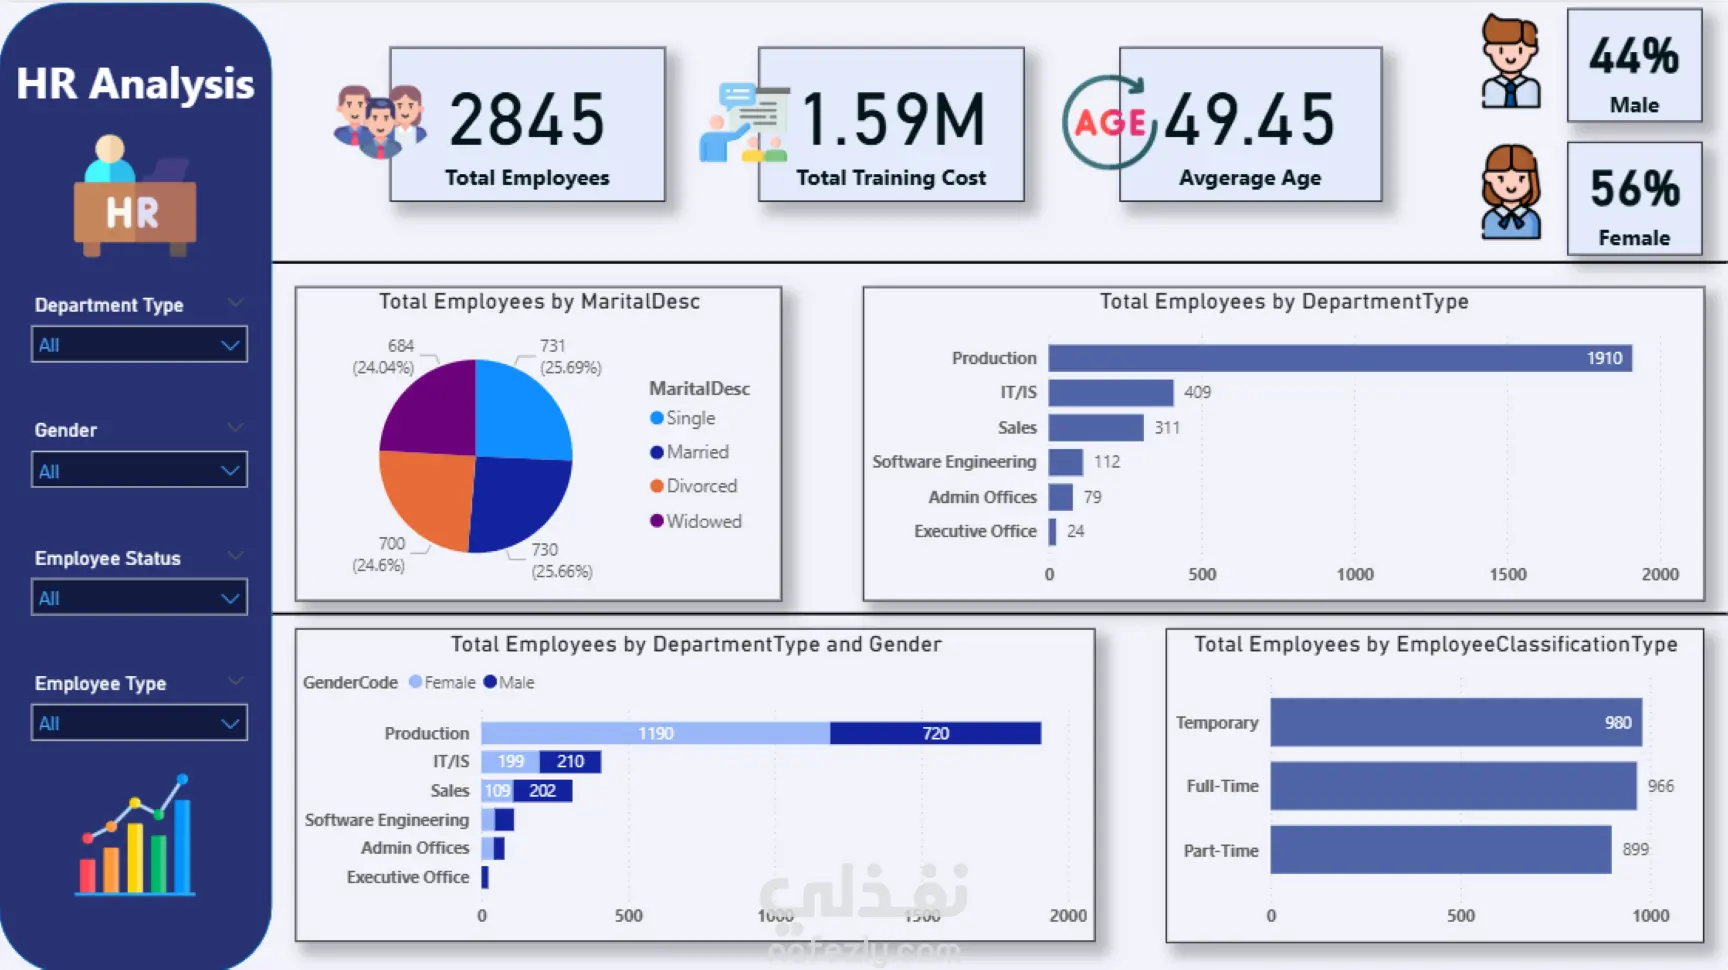
KPI Scorecards: At-a-glance metrics for total employees (2,845), total training cost ($1.59M), and average employee age (49.45).
Interactive Filters: Dynamic filtering by department, gender, employee status, and type, allowing for granular analysis.
Visualizations: Utilized pie charts, bar charts, and stacked bars to clearly present data on marital status, departmental distribution, and gender ratios within departments.
Actionable Insights: Revealed key trends, such as the balanced distribution of employment types (Full-Time, Part-Time, Temporary) and the significant size of the Production department.
Impact: The dashboard successfully consolidated disparate HR data into a single source of truth, enabling stakeholders to quickly identify trends, analyze workforce composition, and make informed strategic decisions.