Interactive Walmart Sales Analysis Dashboard

تفاصيل العمل
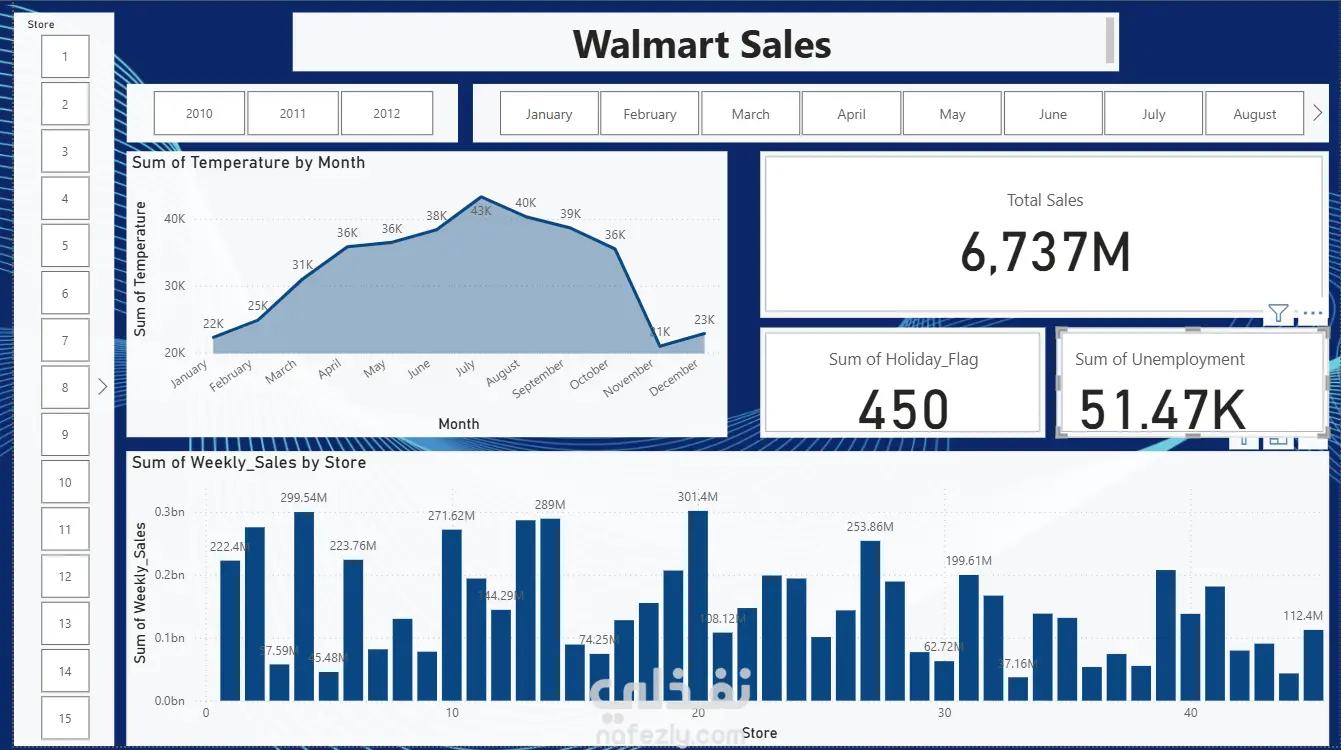
This is a comprehensive and fully interactive dashboard I designed and developed using Microsoft Power BI to analyze extensive sales data for Walmart. This project showcases my ability to not just visualize data, but to transform it into a compelling visual story, rich with actionable insights that empower management to make informed, strategic decisions. Project Objective: The primary goal of this dashboard is to enable decision-makers to answer vital business questions at a glance, including: What is the overall sales and profit performance? Which regions and cities are the top performers? What are the most popular product categories and customer segments? Who are the most valuable customers? How does sales performance trend over time? Key Analyses & Dashboard Features: Key Performance Indicators (KPIs): An instant overview of critical metrics like Total Sales, Total Quantity Sold, Total Profit, and Average Profit Margin. Geographical Analysis: An interactive map visualizes sales distribution by city, making it easy to identify strong markets and areas for improvement. Time-Series Analysis: A monthly sales performance chart helps to identify trends, seasonality, and sales patterns throughout the year. Product & Customer Analysis: Dynamic charts break down sales by Product Category and Customer Segment (Consumer, Corporate, etc.). A dynamic table automatically identifies the Top 5 Customers by Sales, highlighting key accounts. Full Interactivity: The dashboard is equipped with dynamic slicers, such as the "Region" filter, allowing users to drill down and filter the entire report with a single click to focus on specific areas of the business. Tools & Technologies Used: Microsoft Power BI: The core tool used for the entire dashboard design, development, and visualization. Power Query: Leveraged for the ETL (Extract, Transform, Load) process, cleaning and preparing the raw dataset of over 9,000 records to ensure data accuracy and consistency. DAX (Data Analysis Expressions): Utilized to write complex calculations and create custom measures, such as 'Average Profit Margin' and other essential KPIs that go beyond basic analysis.
مهارات العمل