Dashboard by power query
تفاصيل العمل
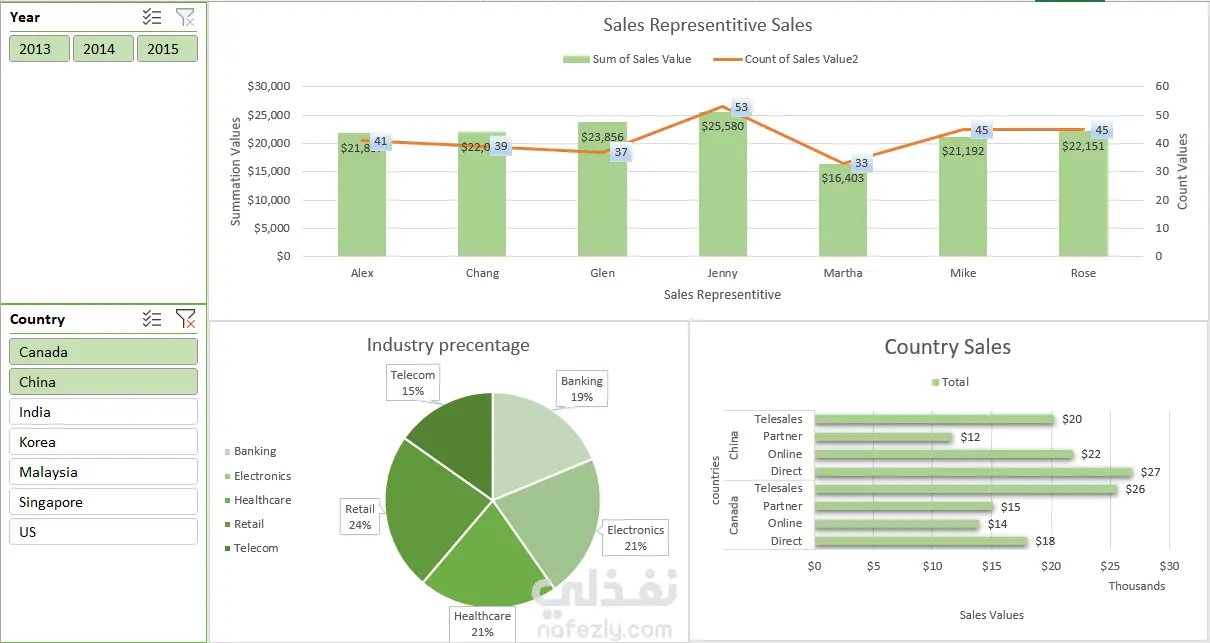
“This dashboard demonstrates strong use of Excel Power Query and data visualization. It includes interactive filters for year and country, multiple chart types (bar, line, and pie), and clear labeling of sales values. The design highlights key insights such as top-performing representatives, industry distribution, and country-level sales. Overall, the dashboard is well-structured, user-friendly, and effectively communicates the data story.”
مهارات العمل