bike store sales dashboard
تفاصيل العمل
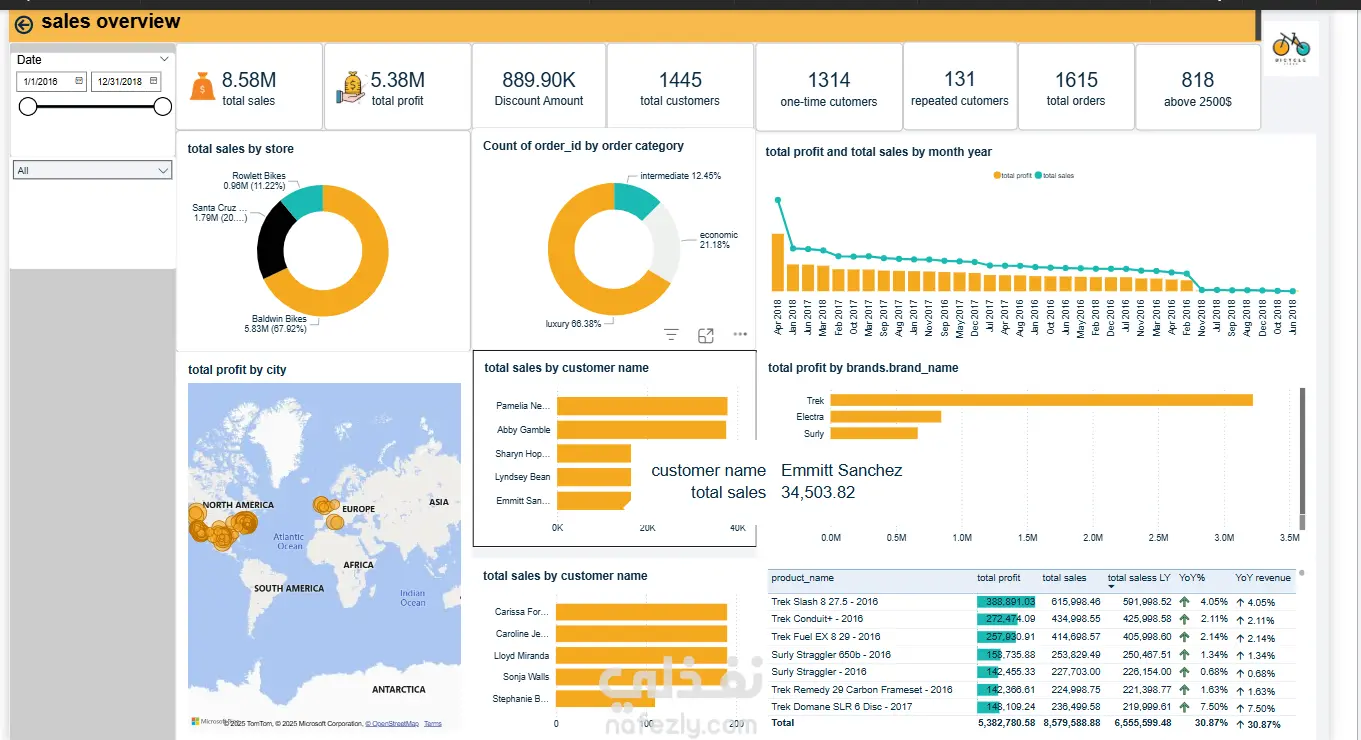
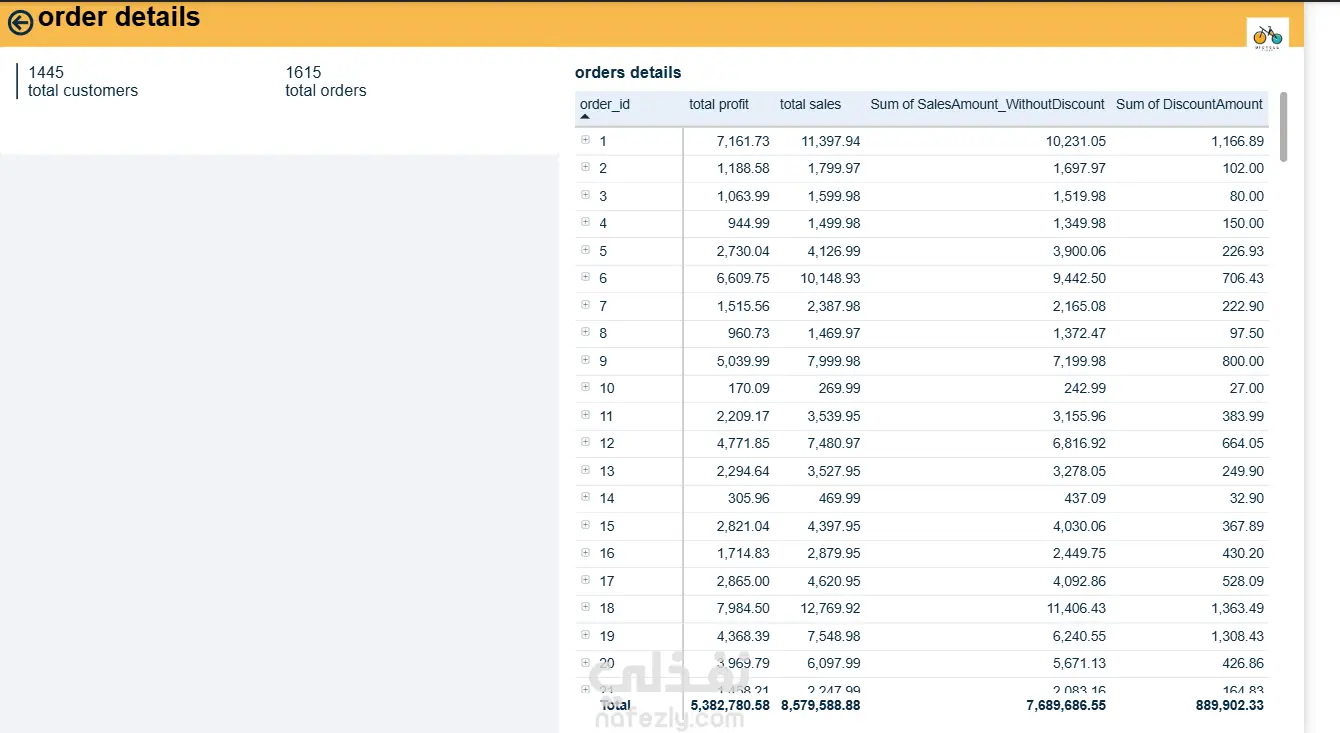
Project Summary Created interactive Power BI dashboard for bike retail chain: monitors 8.5M total sales, 5.3M profit from 1,615 orders across 1,445 customers (88% one-time, 8% repeated). Features slicers (date/category/city), pie charts for sales by store/category (e.g., 62% road bikes), maps for profit by city (clusters in North America/Europe), bars for top customers/brands (e.g., Trek: 2.7M profit), line charts for monthly trends, and order details table with discounts (889K total). Impact Streamlined reporting 40%, identified top performers (e.g., 30% YoY growth in luxury), optimized inventory—boosted repeat sales 12%.
مهارات العمل
بطاقة العمل

طلب عمل مماثل