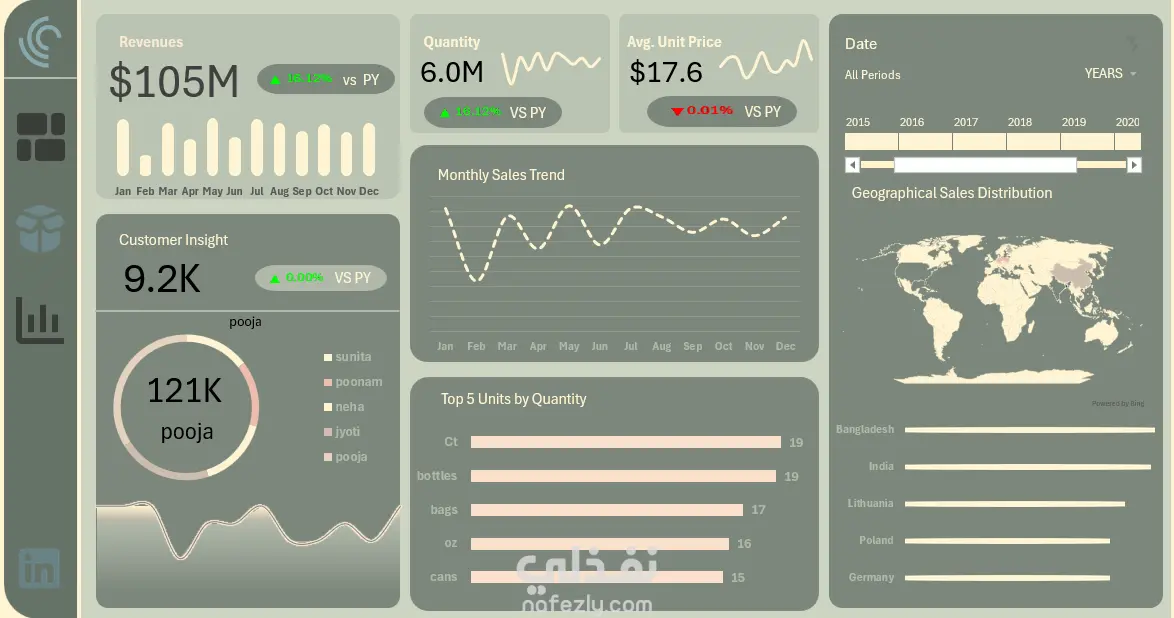
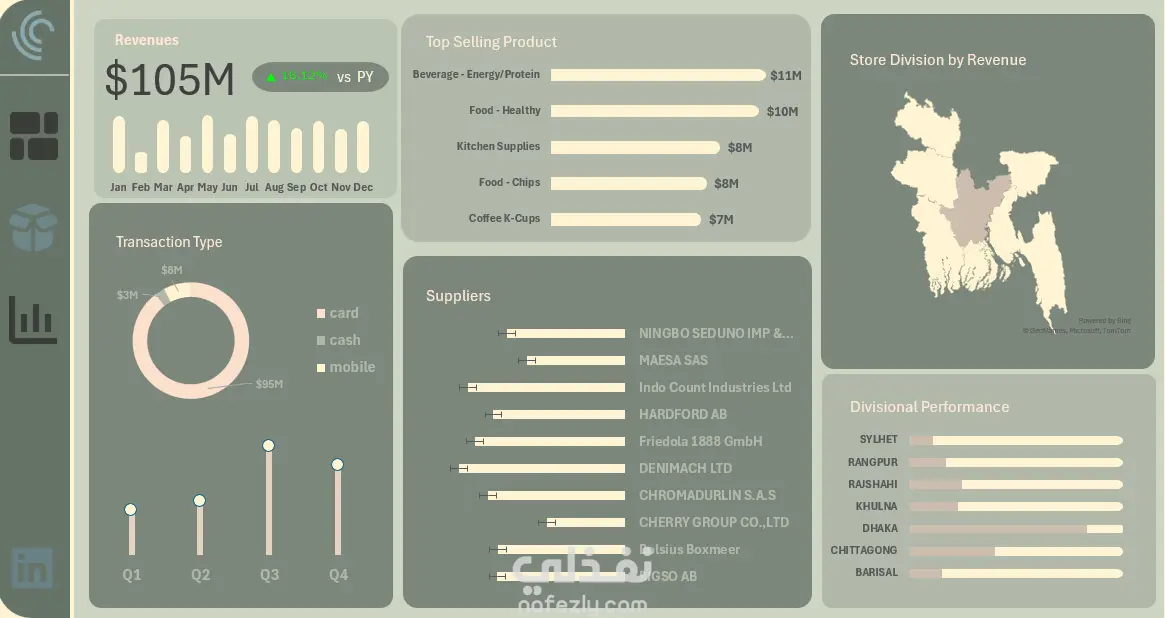
E-commerce Sales Analysis Dashboard
تفاصيل العمل
Instead of just looking at raw numbers, I transformed them into an interactive dashboard that tells the story of each sale — from the moment a customer visits the site until the purchase is complete. Dashboard Highlights: The dashboard covers key business metrics, including: • Total Sales → Overall revenue generated • Total Quantity → Best-selling products • Average Unit Price → Average price per item • Customer Count → Number of unique buyers • Sales by Country → Top-performing markets • Sales by Product → Most in-demand items Key Insights 1️⃣ Varied Sales by Country – Some countries contributed significantly higher sales, showing clear opportunities for market expansion. 2️⃣ Evolving Customer Preferences – A shift in product choices over time highlights trends useful for demand forecasting. 3️⃣ Payment Method Performance – Understanding which payment methods customers prefer revealed opportunities for improving the checkout experience. This project wasn’t just about crunching numbers — it was about understanding customer behaviour, uncovering growth opportunities, and generating actionable recommendations.
مهارات العمل