Candy Sales Analysis Dashboard
تفاصيل العمل
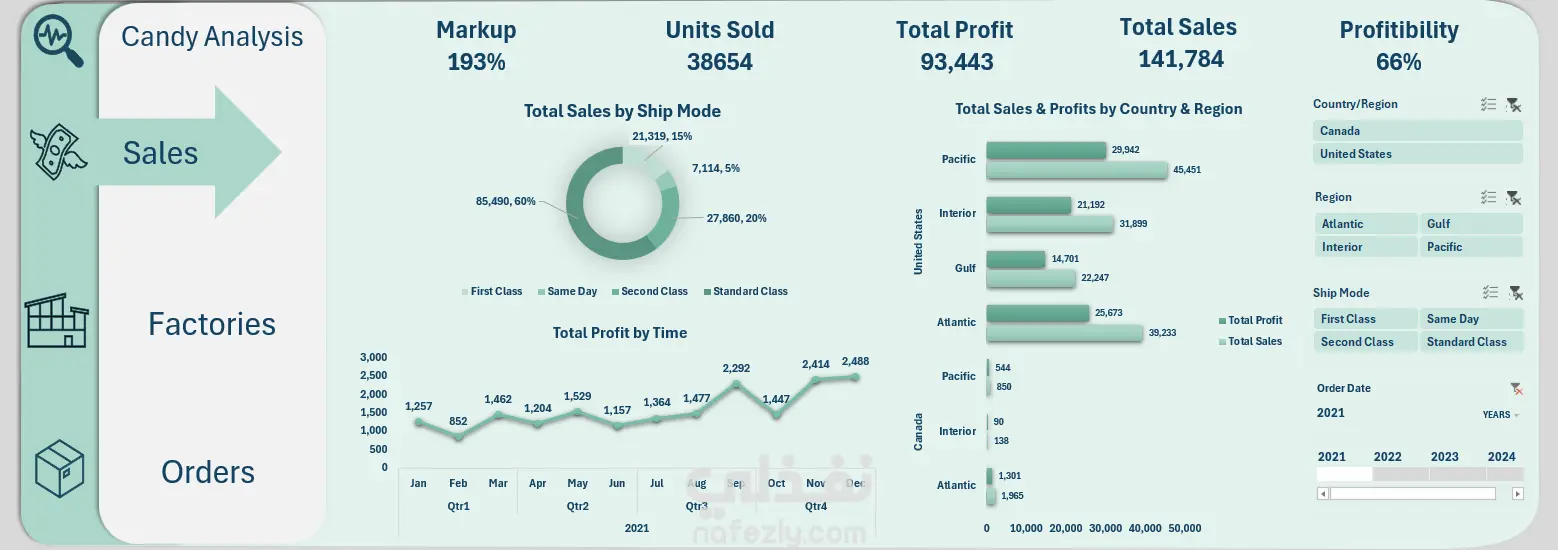
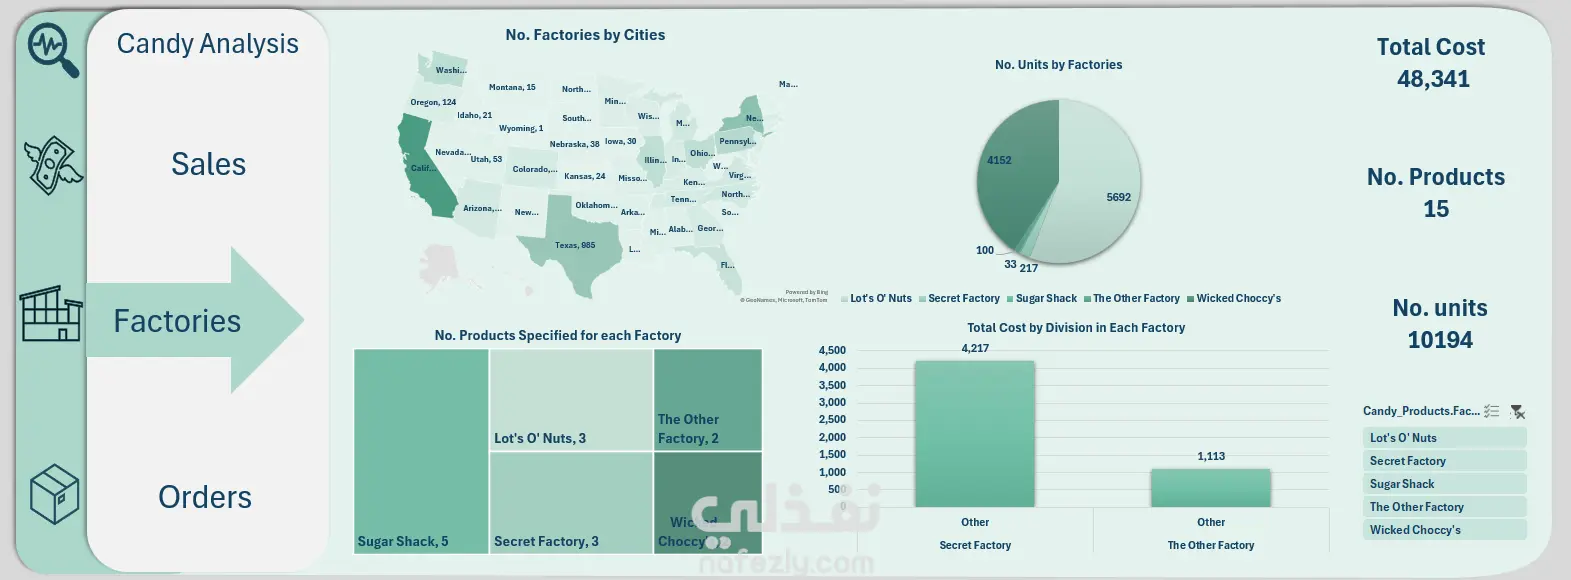
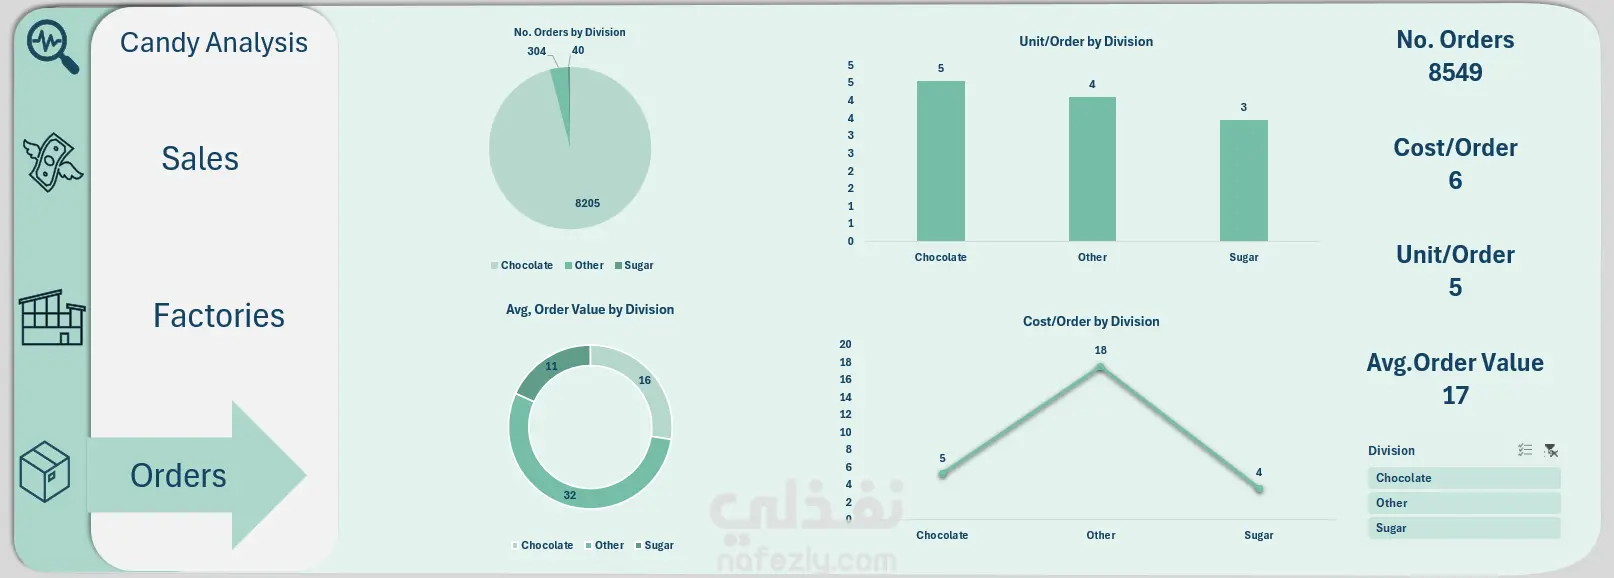
I’ve recently built an interactive Excel dashboard to analyze candy industry performance across Orders, Sales, and Factories. Here are some key insights: Orders Analysis Total Orders: 8,549 with an average of 5 units/order Average Order Value: 17 and Cost/Order: 6 Chocolate division leads in order volume Sales Analysis Units Sold: 38,654 with a Markup of 193% Total Sales: 141,784 | Total Profit: 93,443 | Profitability: 66% Standard Class shipping generates the highest sales Pacific & Interior regions in the US are top performers Factories Analysis Total Units Produced: 10,194 across 15 products Highest output from Sugar Shack and The Other Factory Total Production Cost: 48,341 This Excel dashboard enables performance tracking, regional sales analysis, and production optimization — all in one place.
مهارات العمل